TUTORIAL: VIEWING RATES FOR TELEVISION HISTORY
Tutorial for CLARIAH Media Suite V 5.3
Tutorial Description, Case and Objectives
This tutorial introduces you to using the CLARIAH Media Suite’s search tool and bookmarking functionality for research with the viewing and listening rates collection. The tutorial specifically introduces you to ways of using the Media Suite that support television history teaching and research that aim at critically evaluating processes of viewing rate research and data driven research in television history. Upon completing this tutorial, you will have learned to use the Media Suite for:
-
Searching and building a multimedia corpus consisting of television materials from Netherlands Institute for Sound and Vision’s Television Collection and viewing reports from the digitized collection held by the SKO (Dutch foundation of viewing rate research).
-
Collecting and bookmarking items from different collections into a personal user project.
-
Creating a general research design, by considering practical and methodological implications of using viewing rates for historical television research.
This tutorial centres around an historical research project concerning television viewing during the Dutch Oil crisis of 1973. More specifically, this tutorial will focus on the historical television address by prime minister Joop Den Uyl in december 1973. In this speech Den Uyl informed the Dutch citizens about the measures the government had taken to account for the scarcity in Oil after Arabic countries boycotted the Netherlands from importing oil. A central point in the speech was the end of the Car-free Sundays, and the beginning of controlled distribution of oil through oil-stamps, which were interchangeable for petrol at the petrol stations.
The television address is an iconic and historically unique moment in Dutch history and Dutch television history. It is rare for a Dutch Prime Minister to address the nation, even in times of crisis. Joop Den Uyl was the first, and during the corona pandemic in 2020 Mark Rutte was the second Prime Minister to address citizens directly in Dutch television history. For television history and historical viewing rates research the era of the 1970s is particularly relevant. It features a moment in Dutch media history where the integration of the television medium in news and information distribution is reaching a similar status to the radio. For example, the ‘oudejaarsconference’, a tradition of a cabaret show on december 31st discussing the previous years’ events, was first televised in 1969 and surpassed radio figures by 1973 when comedian Wim Kan explicitly discussed the Oil Crisis. At the same time, viewing rates research and the collection of viewing figures was in its infancy. Starting in 1965, Intomart GfK began conducting audience research in The Netherlands under contract to the public broadcasting association. The main measurement method was through physical log-books or diaries, distributed and collected through the postal service. Each week, the participants would receive a personal diary with the television schedule, indicate which programmes were viewed, and then return the diary.
Beware
Before jumping into the tutorial it should be noted that working with digitized historical sources can be challenging. This tutorial is designed to mimic that process; you will be presented with hurdles aswell as the guidance to overcome them.
Historical sources are often decontextualized in the process of digitization. In order to interpret the sources adequately it is important to have a basic understanding of the methodological process through which the viewing rates were produced.
This is a tutorial at an advanced level. If you would like to learn to work with the Viewing Rates at a beginners’ level, please go to this tutorial about the Fabeltjeskrant .
Information page viewing rates
If you want more information about reading viewing rates, see the
‘How To’ page here
To learn more about the Dutch history of viewing rates research I would advice you to watch this video presentation created for the Webinar series:
Prerequisites
Previous experience with the Media Suite is not necessary before beginning this tutorial at step 1. Based on your experience level with the Media Suite you can start this tutorial at later steps. If you are already familiar with logging in and creating a user project, you can start this tutorial at step 4. If you are familiar with adding bookmarks to your user project, you can start at step 6. If you are following the webinar series, it may be helpful to create a user project beforehand. Consider completing step 1-4 before the webinar. On average, step 1-4 will take 5 minutes to complete. Step 5 and 6 will take 10 minutes. Step 7 through 11 will approximately take 15 minutes depending on the reflection questions. It follows that step 1-6 takes 15 minutes and step 1-11, the entire tutorial, takes 30 minutes.
Steps
(steps 1-4 take approximately 5 minutes)
-
Use a Chrome or Firefox browser (the Media Suite has been tested primarily in Chrome so this is the browser that works best)**
-
Go to mediasuite.clariah.nl
-
Click on the “Log in” button at the top right of the page
-
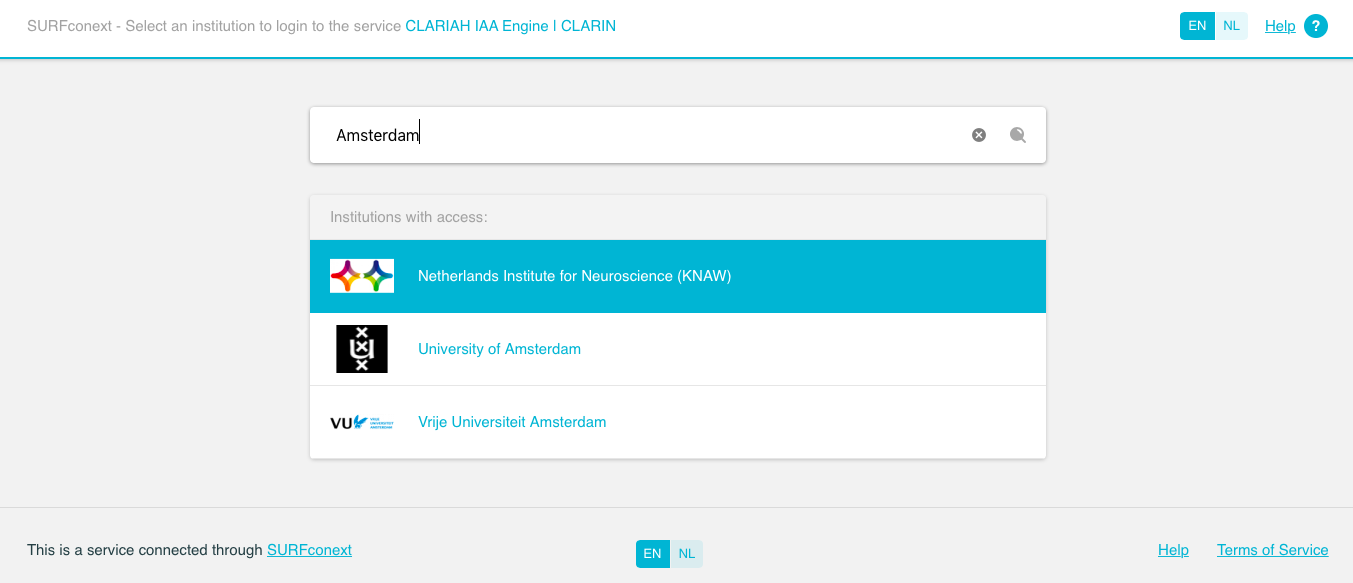
In the SURFConext interface, search for the name of your institution, or scroll through the list
-
Select your institution
-
Use your institutional credentials - either student or employee login - to log in. Wait until the service connects (NB when logging in the first time, you will have to accept Terms of Use and Privacy)
-
You will now enter the Media Suite
2. The Media Suite Workspace

-
To enter the Media Suite Workspace click on the tab “Workspace.”
-
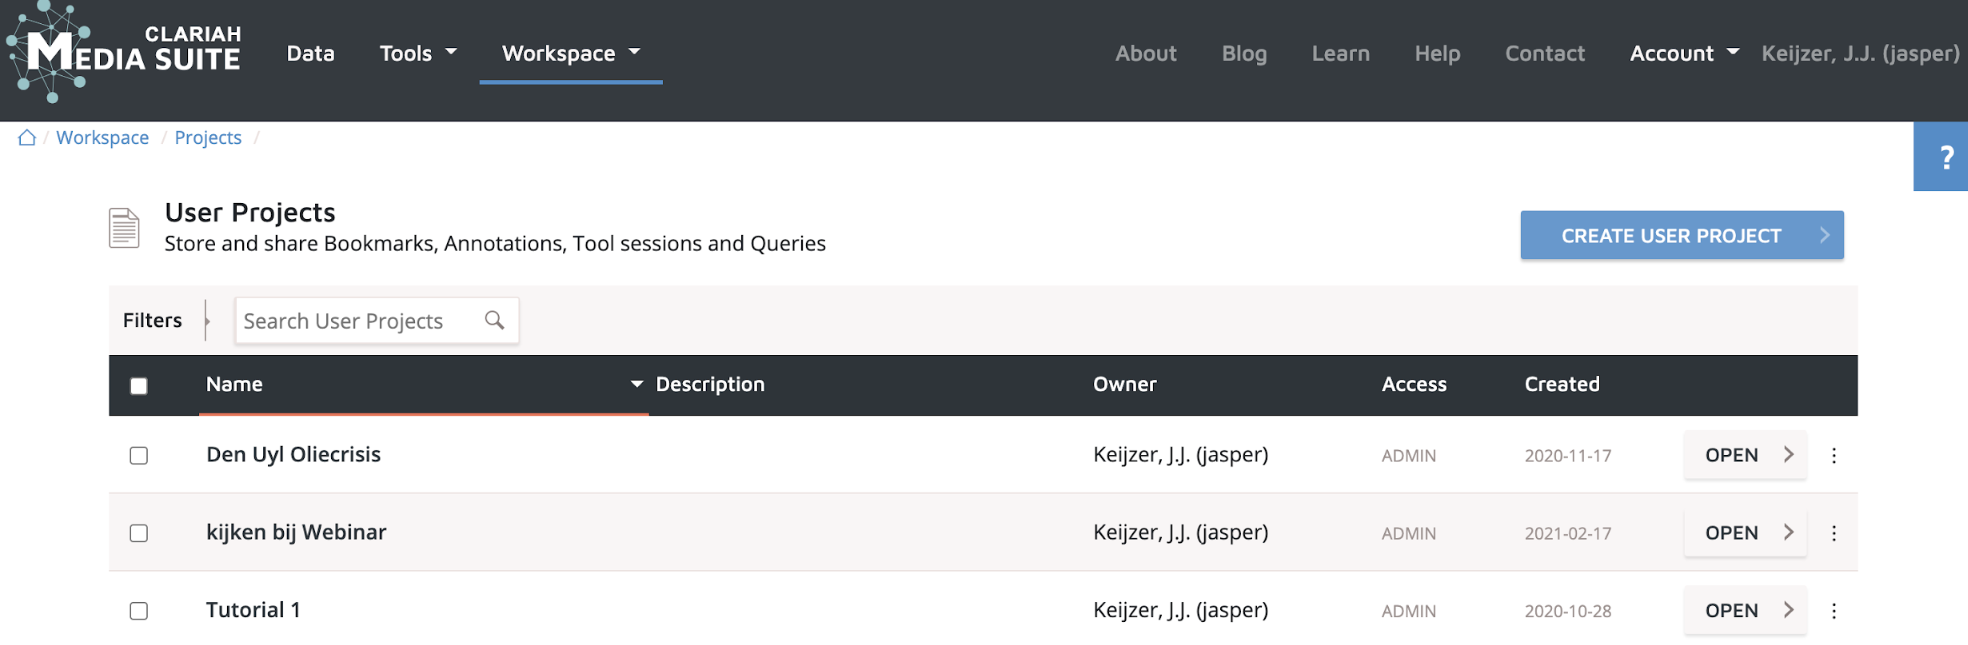
A drop down menu will open with three options. You can visit your user projects in the workspace, create a new user project immediately or you can visit the Jupyter Notebook information page. We first want to explore the workspace in this tutorial. Click on User projects, you will now enter the workspace.
-
In the Media Suite’s Workspace you can manage and search your user projects and the bookmarks and annotations they contain.
3. Create a User Project
-
To create a user project, click on the blue button “Create User Project” in the upper right part of the Workspace
-
Two boxes will appear asking you to name your user project and add a description, which is optional.
-
Fill in the name of your User project and click the blue ‘create’ button. We will call the example project ‘Den Uyl is in den olie’ after Vader Abraham’s song about the Oil Crisis, (consider listening at some point after the tutorial https://www.youtube.com/watch?v=T4xZXPLsKi8 )
-
You will now enter your user project overview. This is a central interface where all of your bookmarked items will be collected. Newspapers, television broadcasts and viewing rates from different collections can be viewed here. Great for making intertextual connections!
4. Enter Search Tool, select a collection and Boolean search options
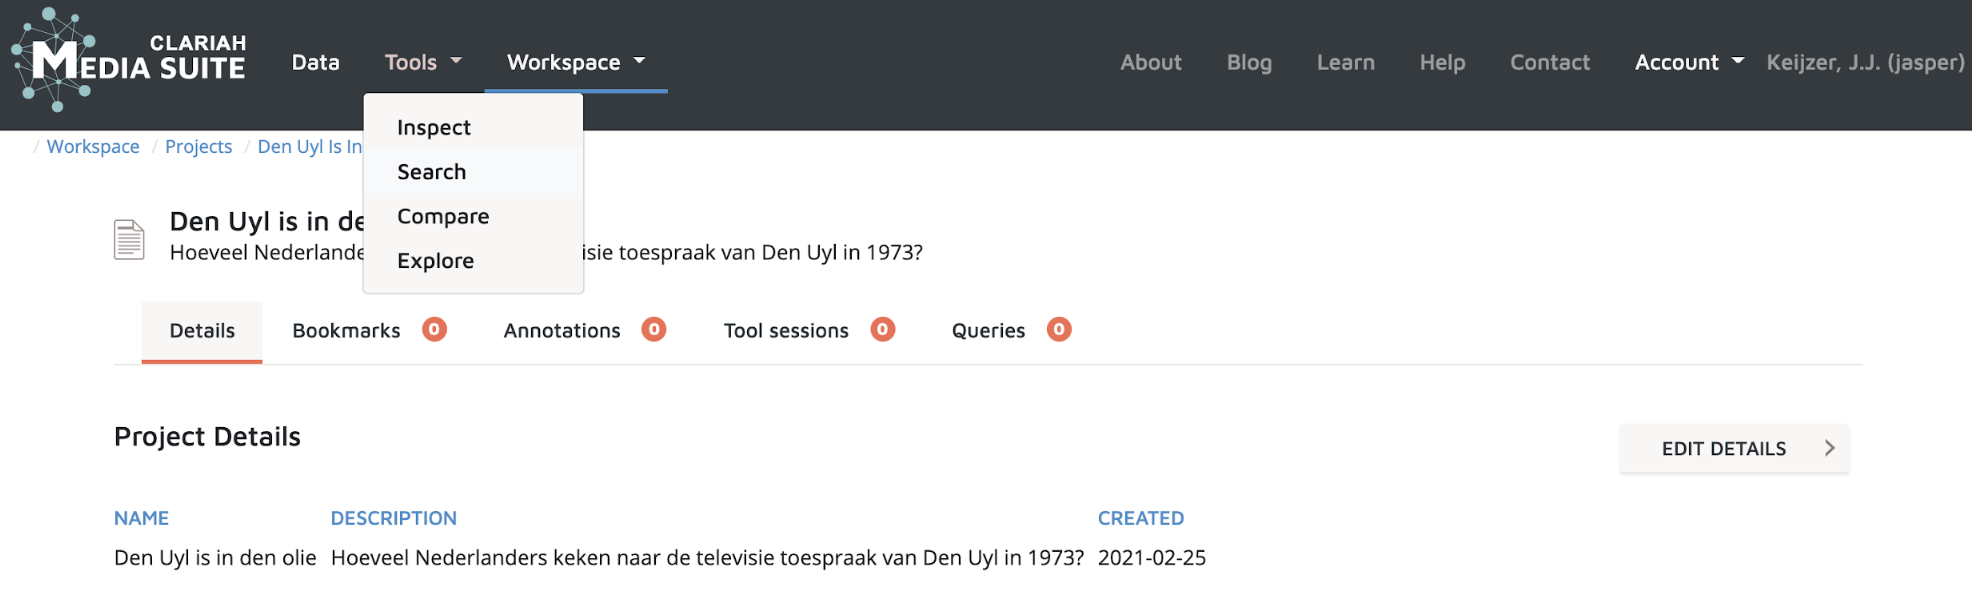
- Click on the ‘tools’ tab in the top left corner. A drop down menu will appear with four options. Click the ‘search’ button. You will now enter the search tool environment
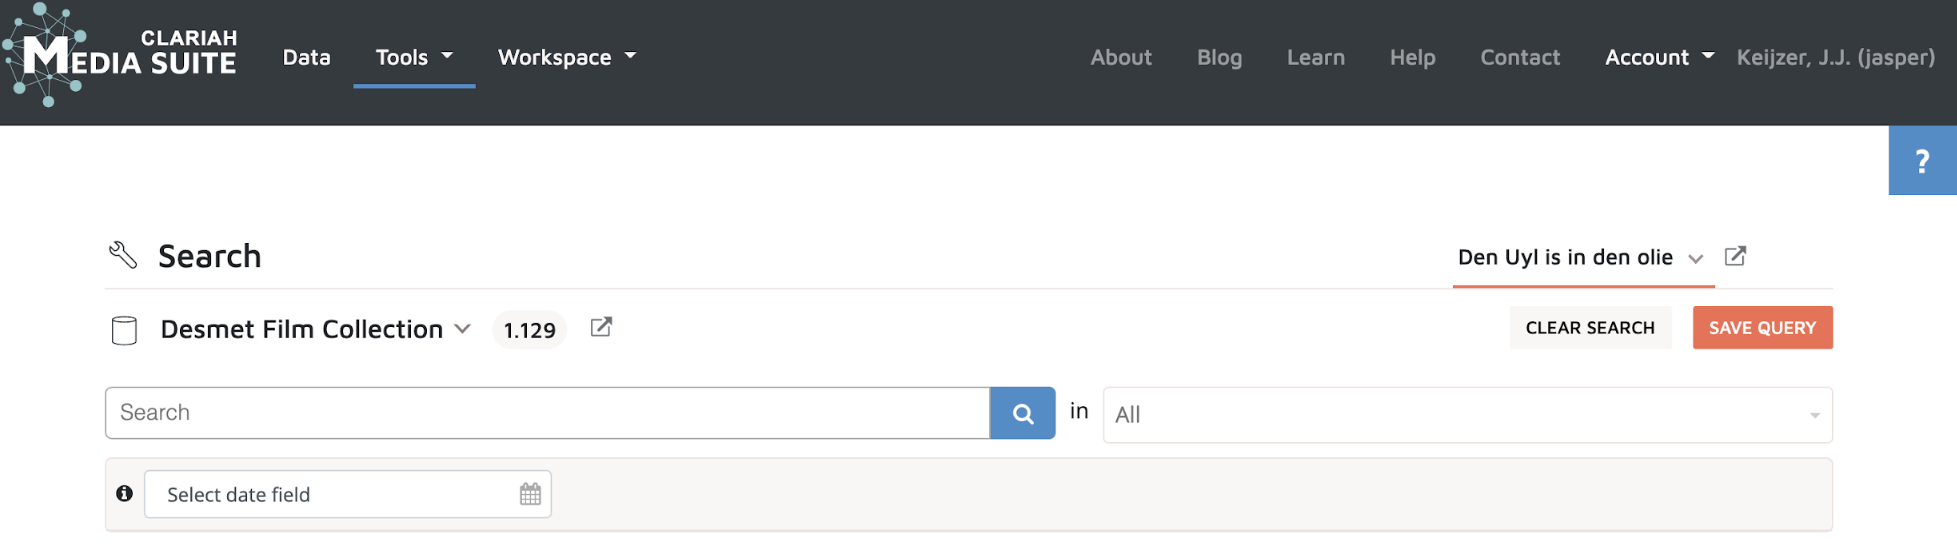
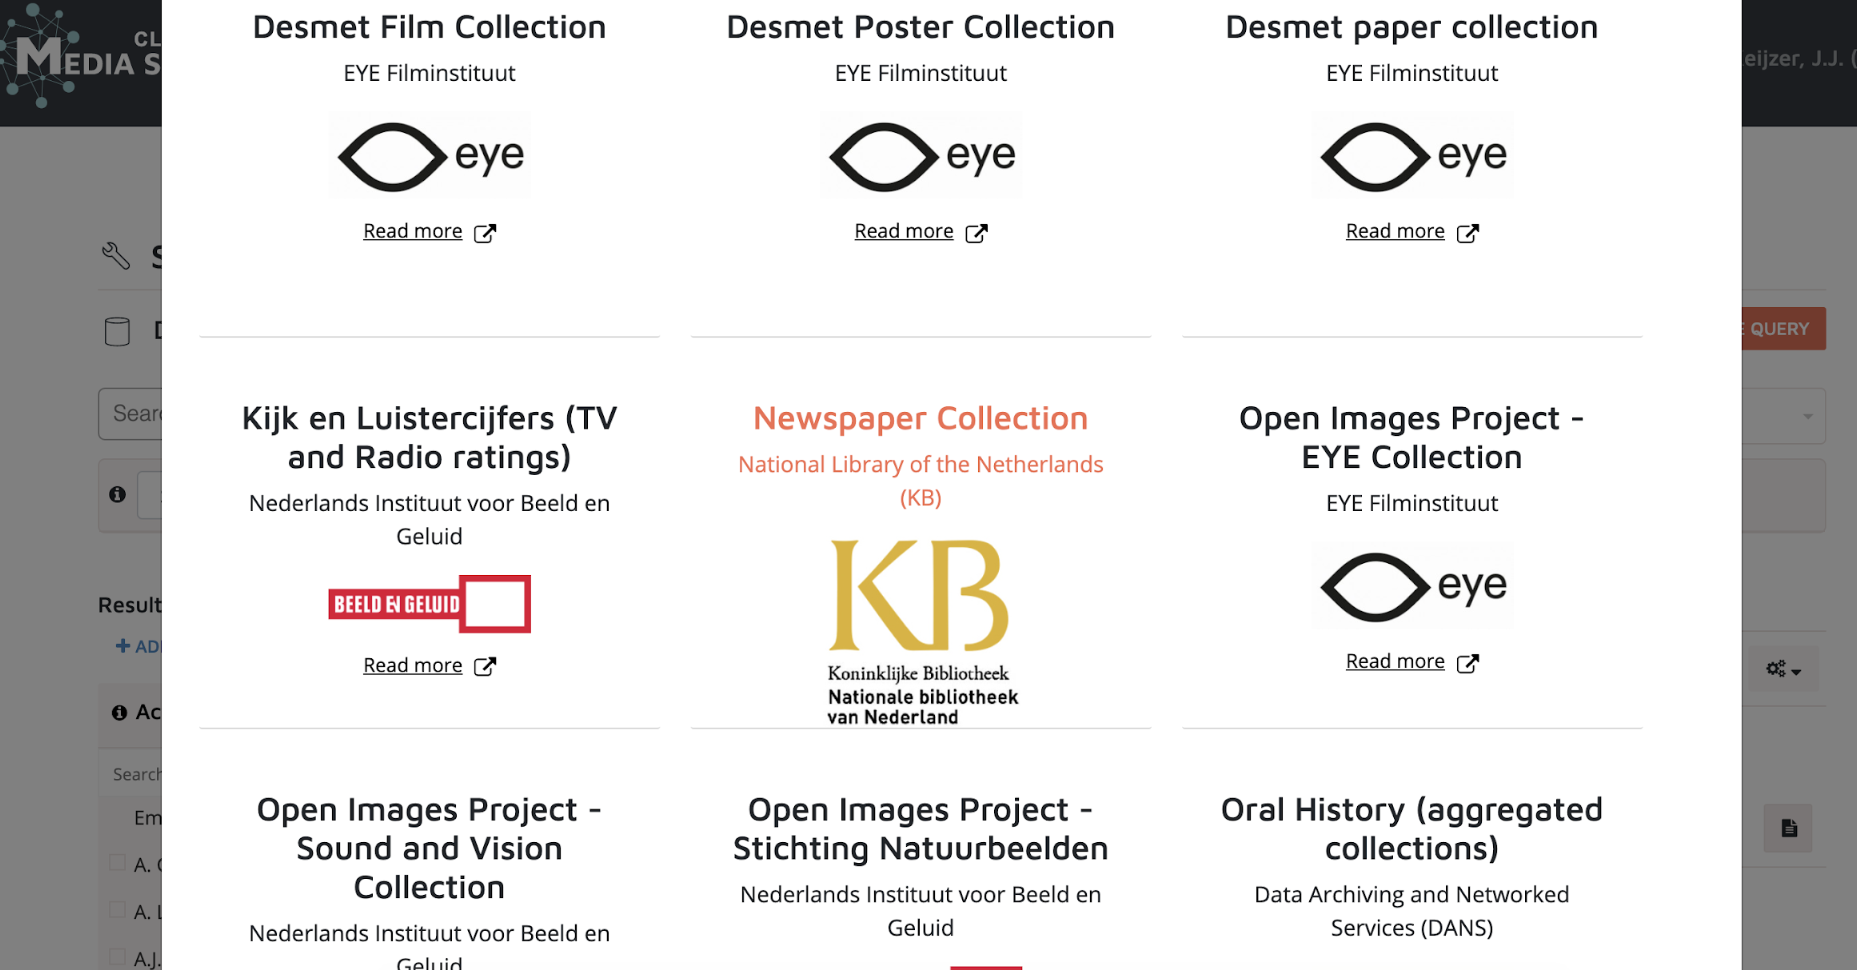
- Just above the search bar you will need to select in which collection you wish to search. If this is your first time visiting the search tool you might not have a collection selected. If you are revisiting the search tool, your last visited collection will be automatically selected. To change this, click on the collection bar. A menu will appear with all the collections.
-
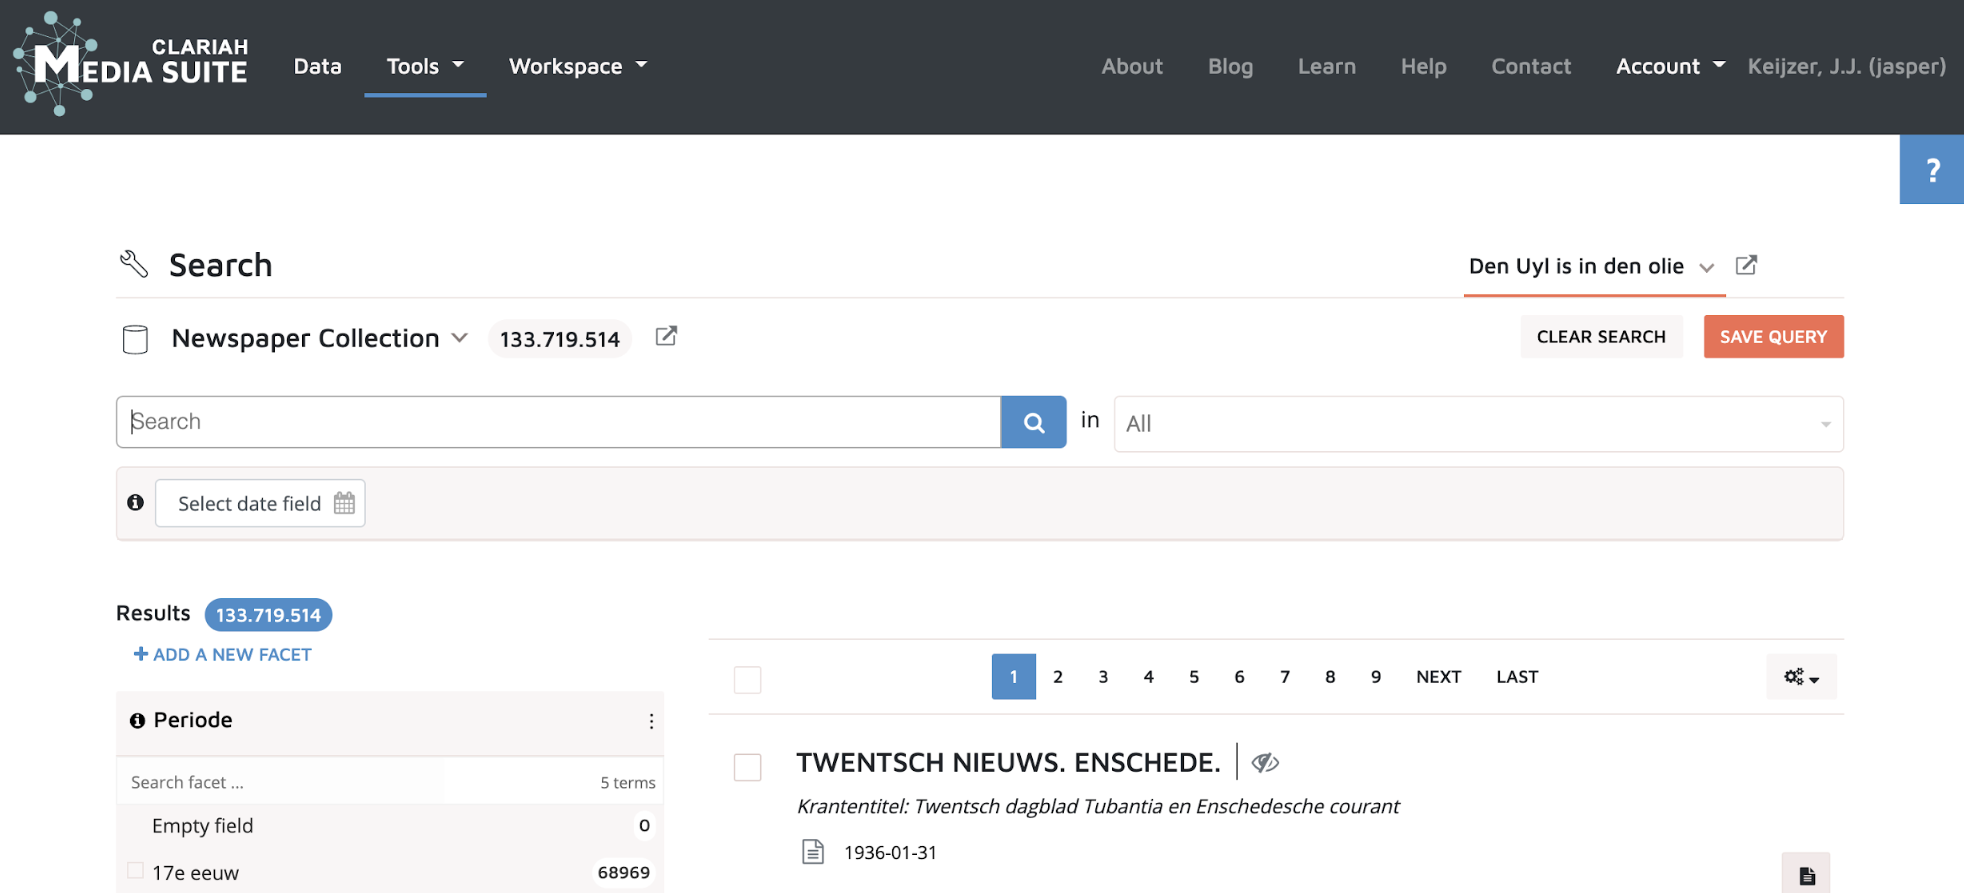
Please select the ‘Newspaper Collection’ for the first part of this tutorial.
-
Feel free to play around with the search options. Enter different keywords into the search bar. Always try multiple search terms in different combinations. Take a moment to reflect on which terms work well . Which terms give the most relevant results and why do you think so?
-
Try to make a boolean query with these terms:
- To make your searches more targeted you may add Boolean query operators such as: AND, OR, NOT, Asterisk, Parentheses, Quotation Marks (if clarification is needed, see also Media Suite Boolean query how-to guide: https://bit.ly/2WLTWOK )
5. Searching and Bookmarking
(Steps 5 and 6 take approximately 10 minutes)\
-
For the first exercise you will need to find the date and time of Joop Den Uyl’s television address. You know that it was broadcast in december of 1973, concerning the oil crisis. Since the address interrupted the scheduled programming, there might have been an announcement in the newspaper.
-
Try different search terms and combinations. The search terms should be in Dutch. For instance: ‘Joop Den Uyl’, ‘Den Uyl’, ‘oliecrisis’, ‘energiecrisis’, ‘toespraak’, ‘televisie’, ‘tv’.
-
To judge the relevance of the results, try reading the description first and pay close attention to the date stamp.
-
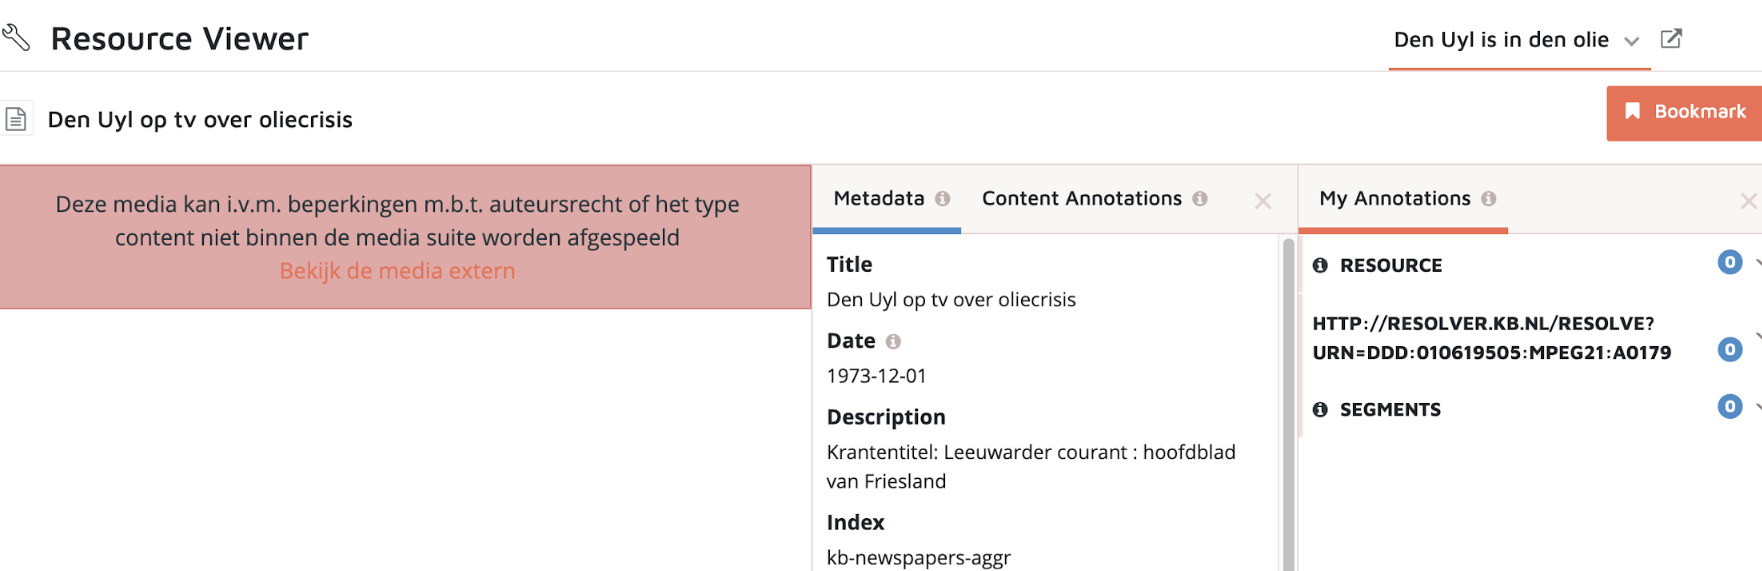
If you have found the desired result, click on it. You will now enter the Resource Viewer.
-
As the red text box indicates, you will need to follow the link to an external site in order to see the contents of the newspaper. The Delpher collection is only viewable in their own webpage environment due to copyright issues.
-
Click on the link. A Depher web page will open and the newspaper clipping will be viewable.
-
Once you found the announcement make a note of the date and time. Return to the Media Suite
-
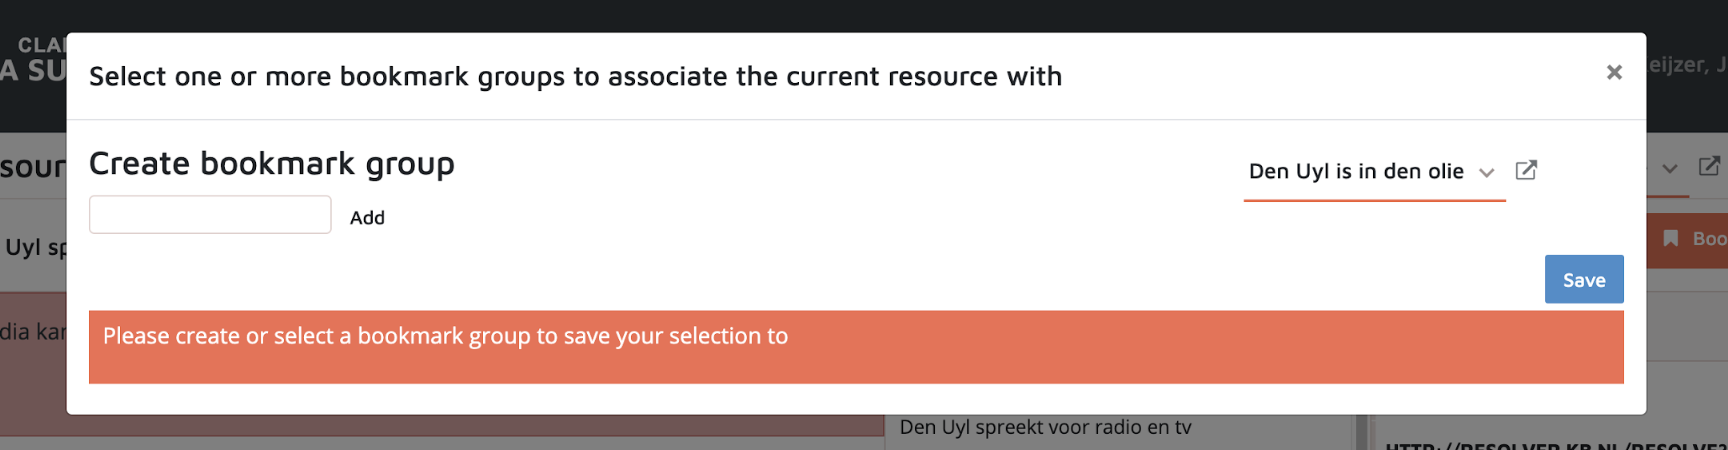
If you want to add the item to your corpus in your user project, click on the orange ‘bookmark’ button in the top right corner. This will open the bookmark options.
-
First, check if the correct user project is displayed on the right hand side above the oranje line. Change the user project if need be.
-
Within a user project bookmarks can be gathered under different bookmark groups. In this tutorial we will create a bookmark group per media type. Click the text box on the left and type in: ‘Newspaper’. Now click on ‘add’. The bookmark group ‘Newspaper’ is now added and selected. If you click the blue ‘save’ button in the bottom right corner your selected newspaper will be saved in your user project, as a bookmark, under the ‘newspaper’ bookmark group.
-
Congratulations! You have just added the first item in your user project. Just remember, the first step is usually the hardest.
6. Searching for a specific television broadcast
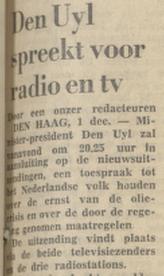
In case you were not successful in the previous step the necessary information can be found in this image taken from ‘NRC-Handelsblad’ published 01-12-1973.
Now we have found the date and time of Den Uyl’s speech, let us see if we can find the actual broadcast.
-
Go back to the search tool by clicking on tools → search.
-
Change the collection by clicking on the ‘Newspaper Collection’ tab.
-
Scroll down and find the “Sound and Vision Television Archive (up to 2018, iMMix version, deprecated)” and click it. Because of differences in metadata categories the Sound and Vision archive is natively divided into multiple collections, each with its own organizing structure and logic. The “deprecated” version of these collections contains the combined contents, it is therefore generally advisable to search these collections.
-
Once you click on the collection, you will enter the same search tool environment but you are searching in a different collection.
-
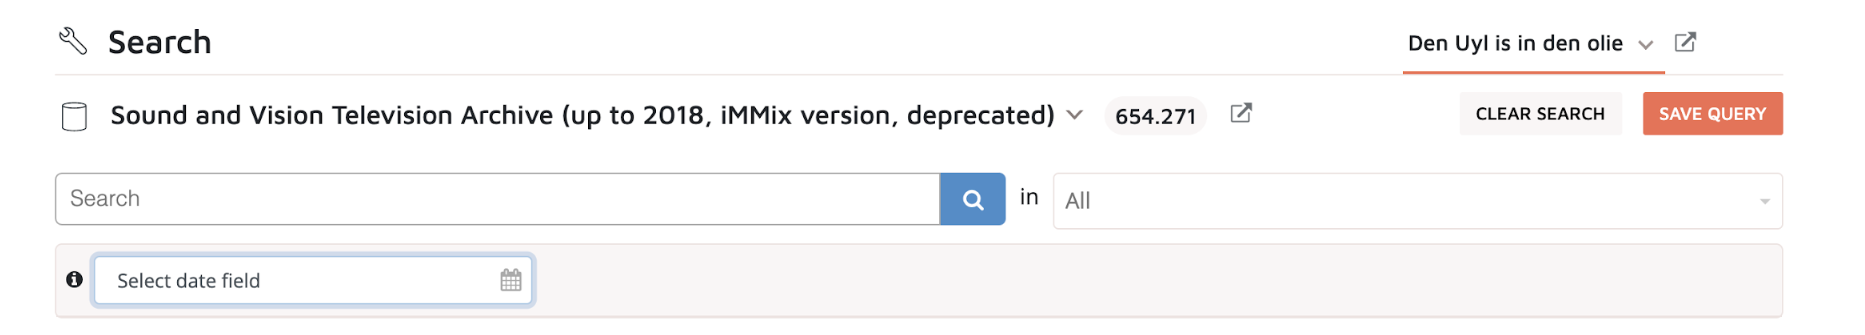
Below the search bar there is an option to select the date field. Click on the tab. A number of options will appear.
-
For this tutorial we will use the preferred option. Click on ‘Date, sorting (PREFERRED)’
-
You can now select a date field in which you wish to search. Date ranges are added to increase the specificity of your desired search results. Set a date range of about three weeks around the day of the broadcast.
-
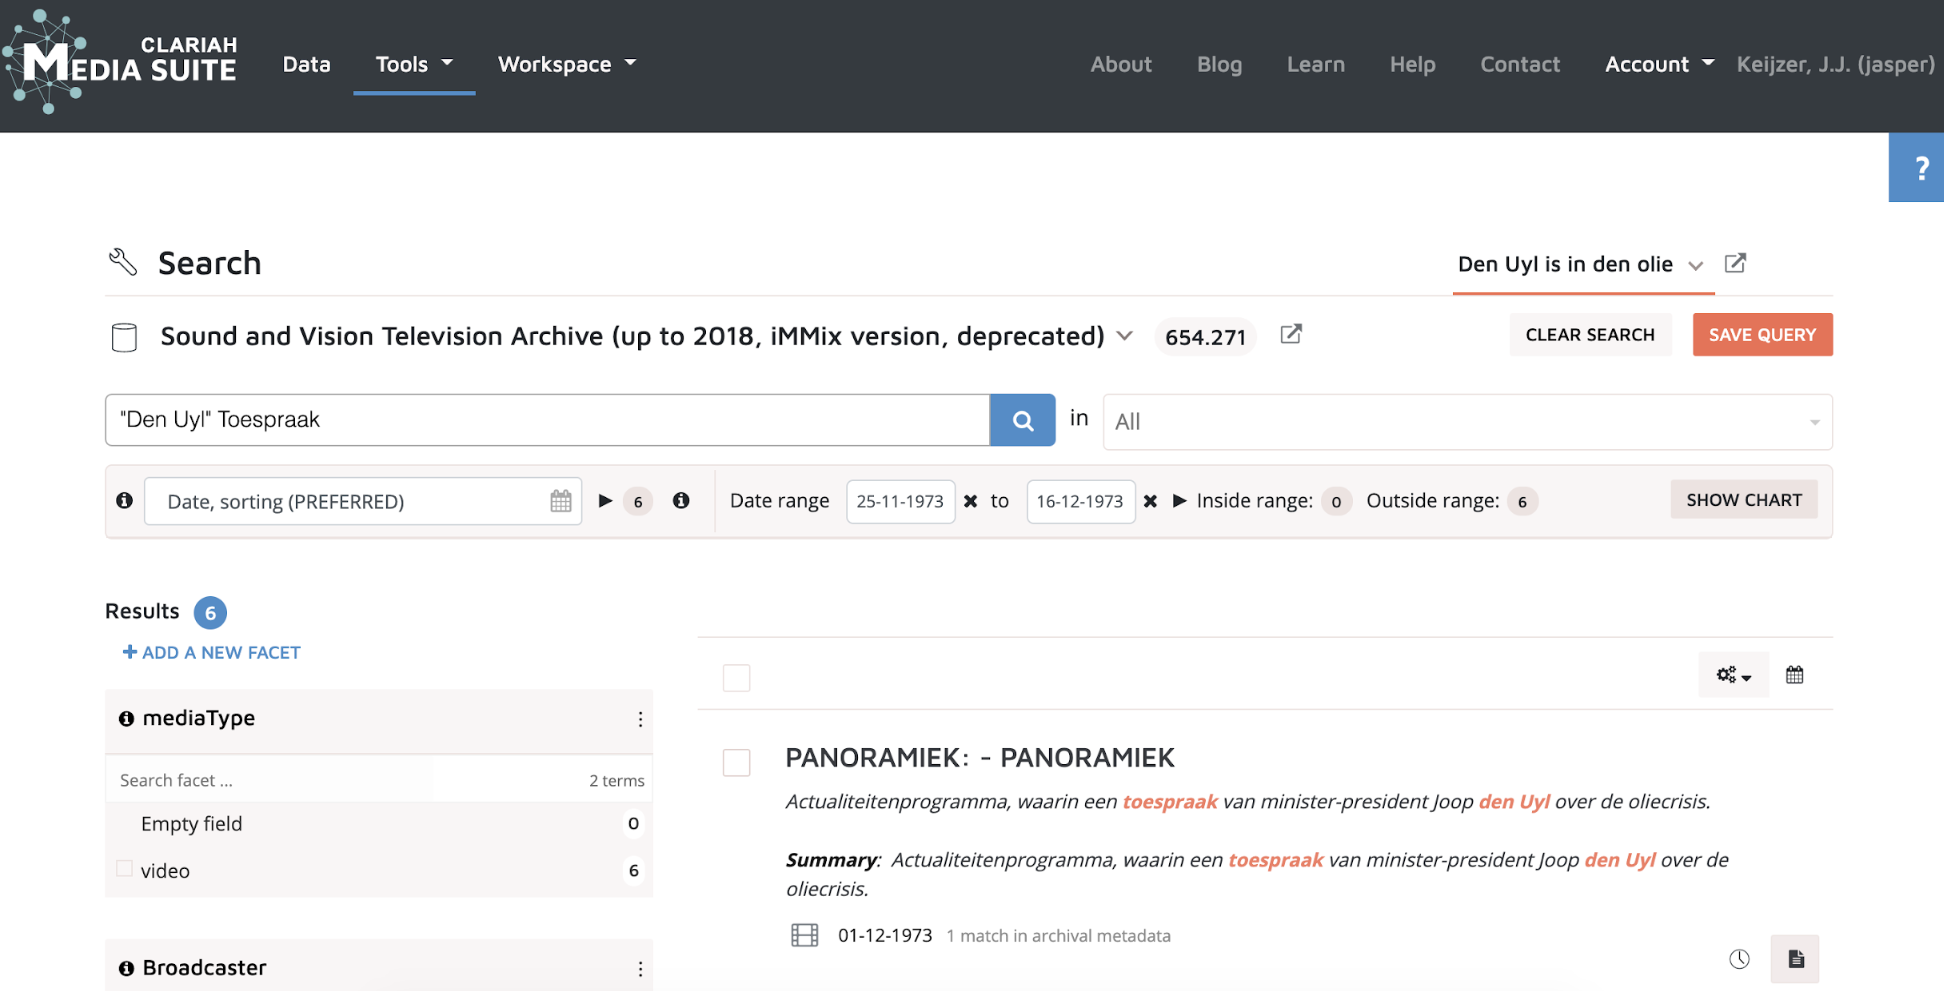
After you are happy with your date range, enter search terms in the search bar. This could be the same keywords or combinations you have tried before. Remember: ‘Joop Den Uyl’, ‘Den Uyl’, ‘oliecrisis’, ‘energiecrisis’, ‘toespraak’.
-
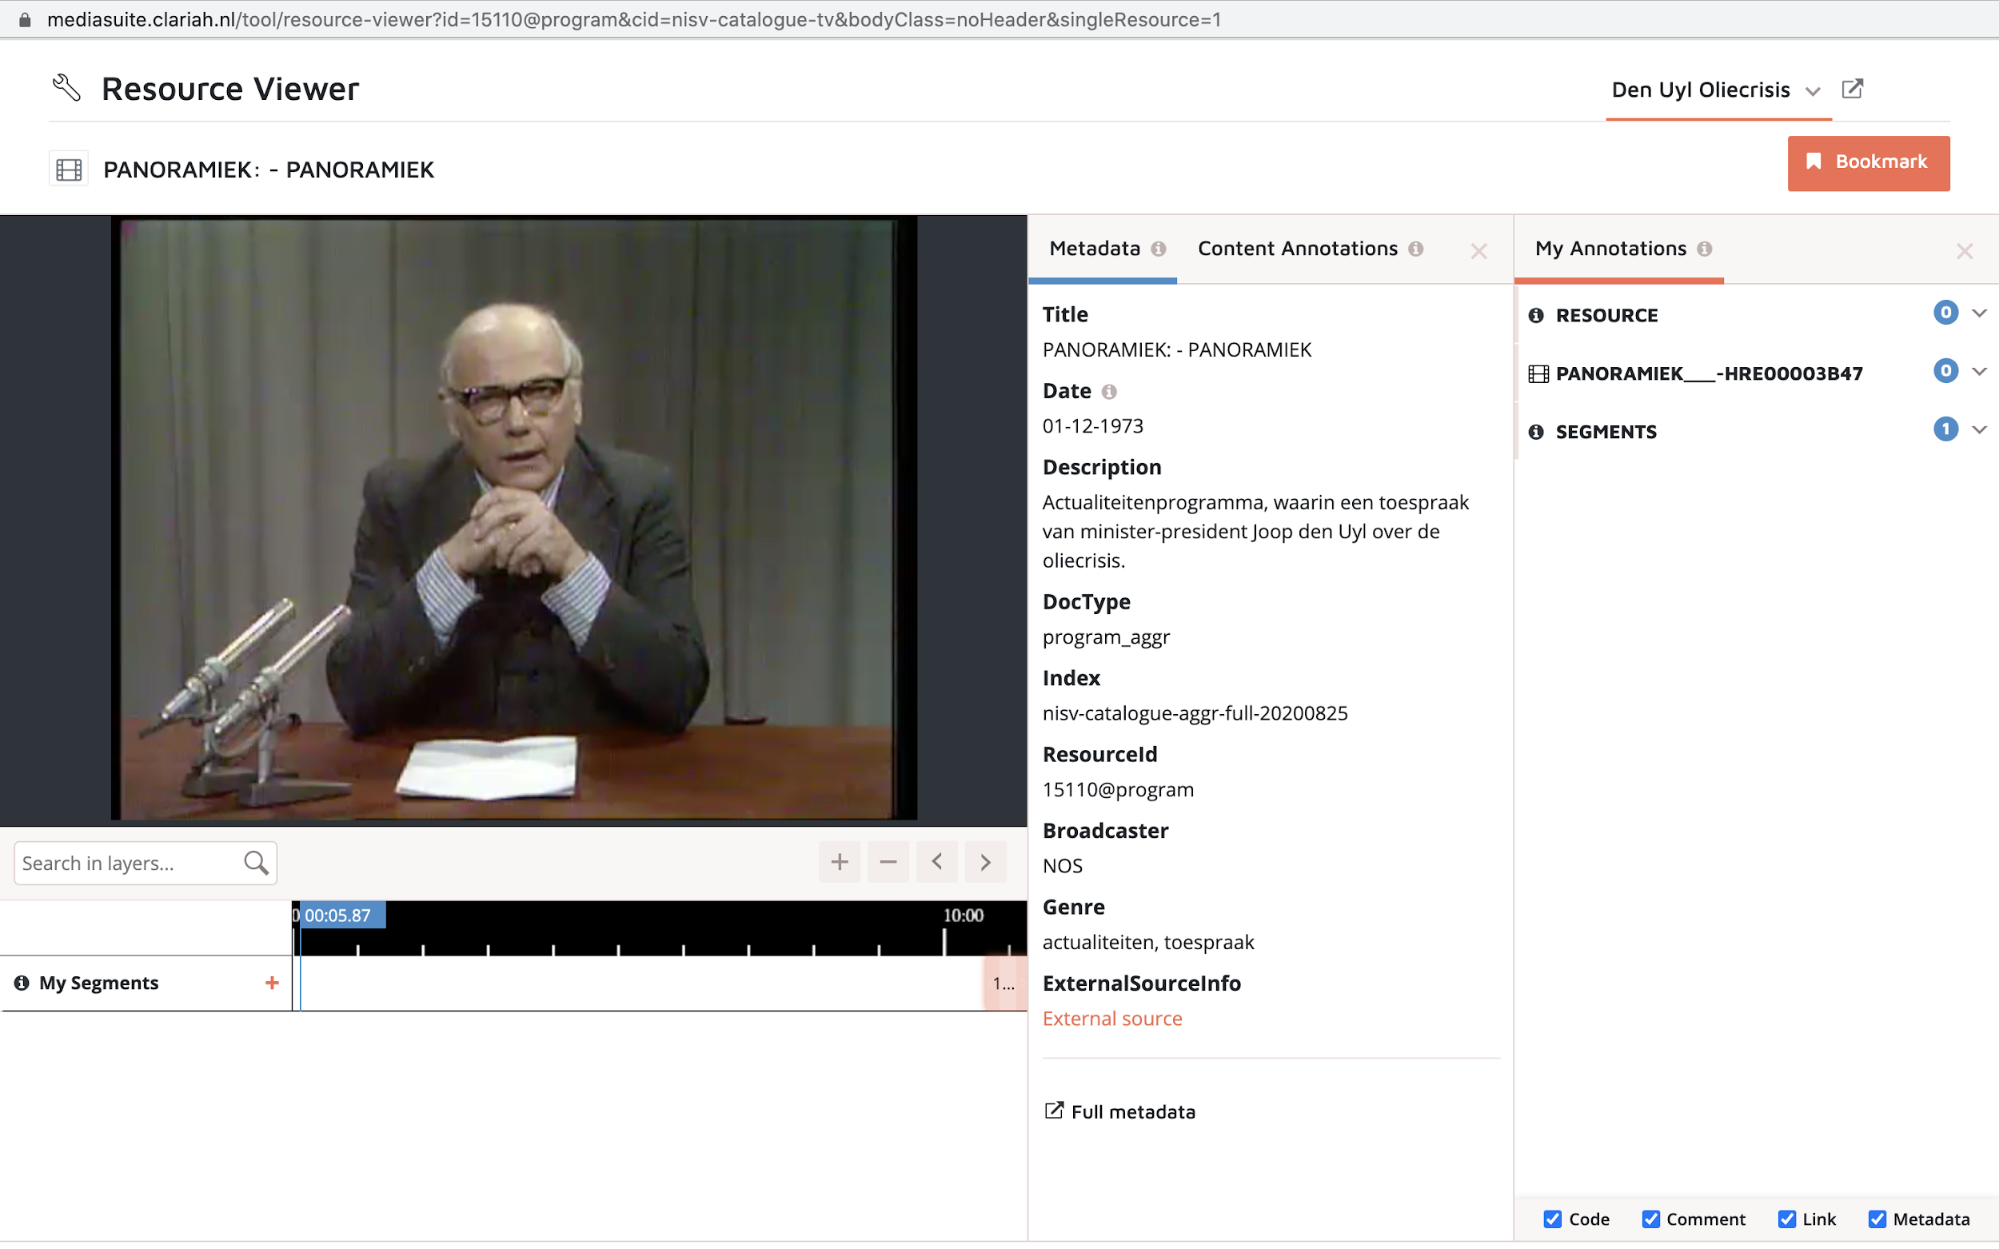
Did you find the speech? Click on a number of results to view their content. Your screen might look similar to the image below:
-
Once you have found the speech, take a moment to watch a part of it and reflect on what you see. What does the metadata say? What is the title of the program, and why would that be the title?
-
Don’t forget to bookmark the item. Click the orange ‘bookmark’ button in the top right corner. Add a new bookmark group called: ‘broadcast’ and click on the blue ‘save’ button.
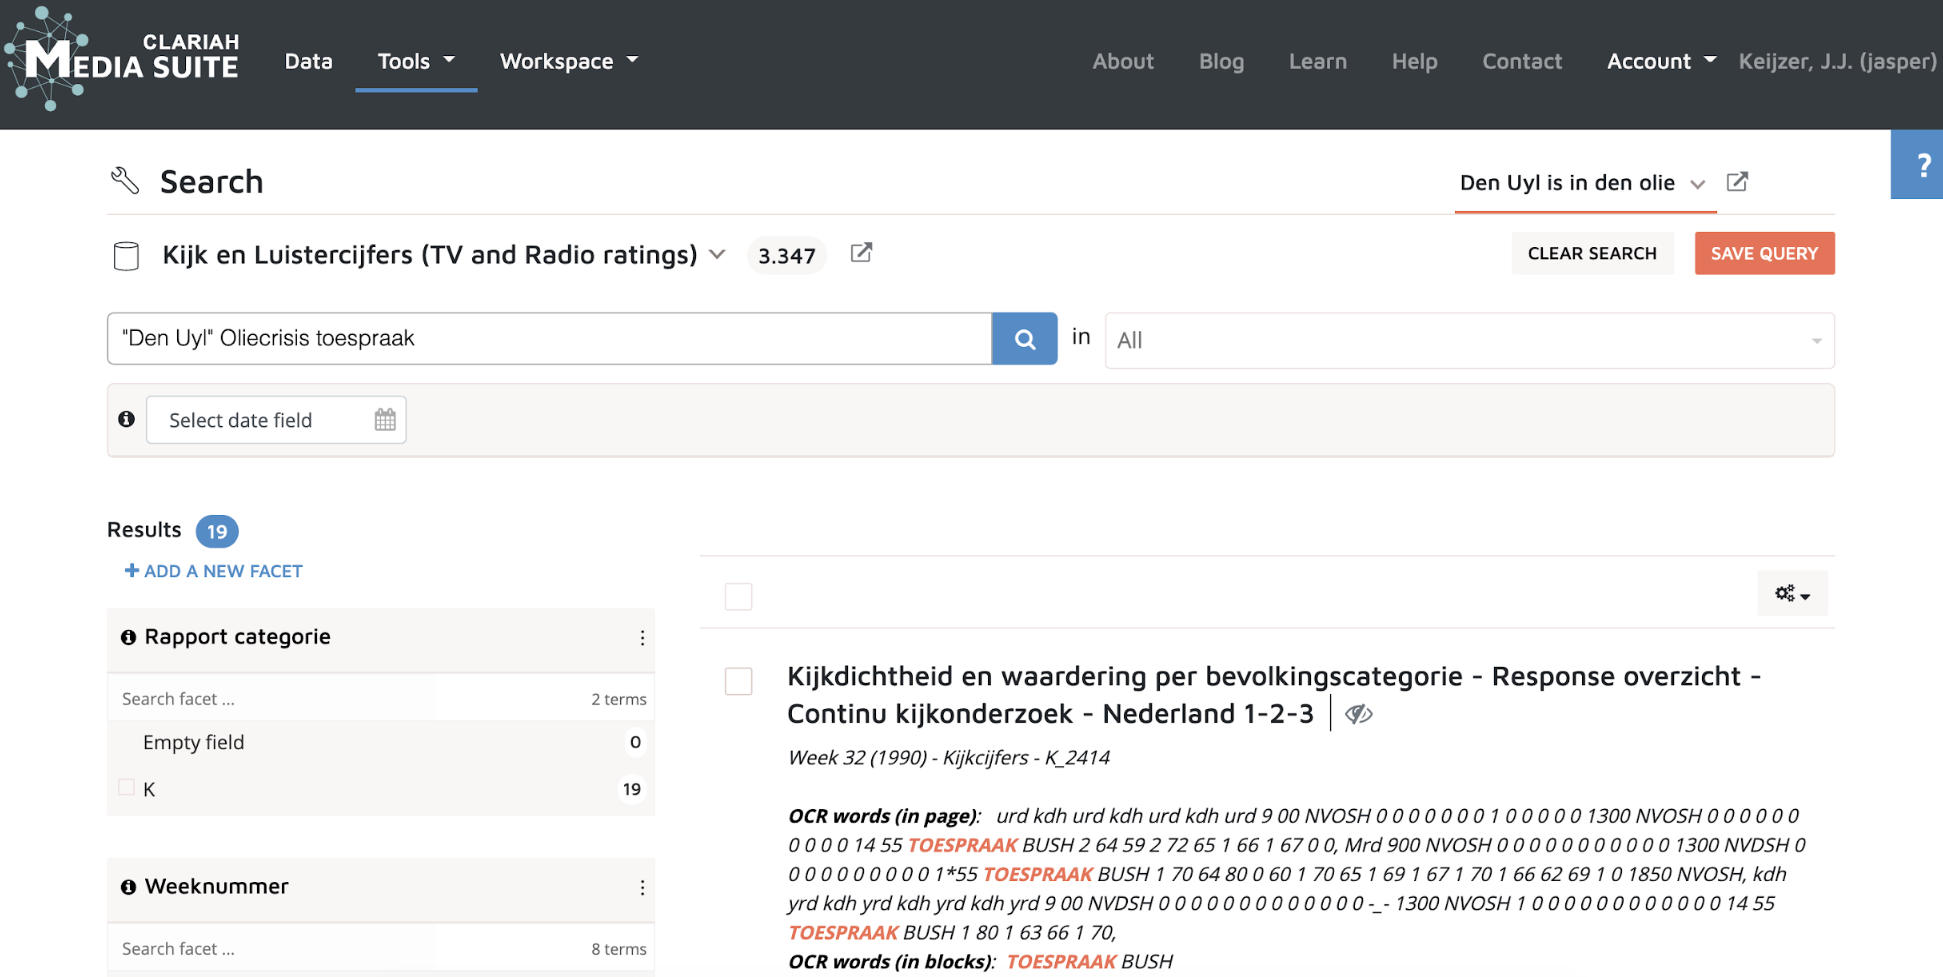
7. Searching for corresponding viewing rates
(Steps 7-11 take approximately 15 minutes)
Now we are certain that Den Uyl’s speech was broadcast, let’s see if we can find the viewing report of the corresponding week.
-
Go back to the search tool by clicking on tools → search.
-
Change the collection by clicking on the collections tab.
-
Select the “Kijk en luistercijfers (TV and Radio ratings)” collection.
-
For your first search, try using the same keyword searches as in the Sound and Vision collections by adding the search terms into the search bar (e.g. Den Uyl toespraak).
-
As you can see below, the TV and Radio ratings collection requires a different approach to searching.
-
Take a moment to reflect on the relation between search terms and search results. How does the algorithm connect the two generally? How will the desired results influence your searching strategy?
-
Searching on keywords seems to produce mixed results. Perhaps we could use extra search parameters to narrow down the results. Since we are looking for weekly viewing rate reports, let’s start by selecting a similar date field as in our last search (three weeks, e.g. 28-10-1973 to 20-12-1973). Click on the ‘select date field’ tab and select ‘Begindatum (rapport)’.
-
Remove any keywords from the search bar and click on search.
-
You will now have a number of search results. Some of them are desirable and some are not. Let’s take a look at the facets on the left hand side of the interface. Facets allow you to further specify the search results post search.
-
The first facet gives three options, K, L and R. Respectively these are Kijkcijfers (viewing rates), Luistercijfers (listening rates) and Reclamecijfers (commercial rates). Select facet K and revisit the search results.
-
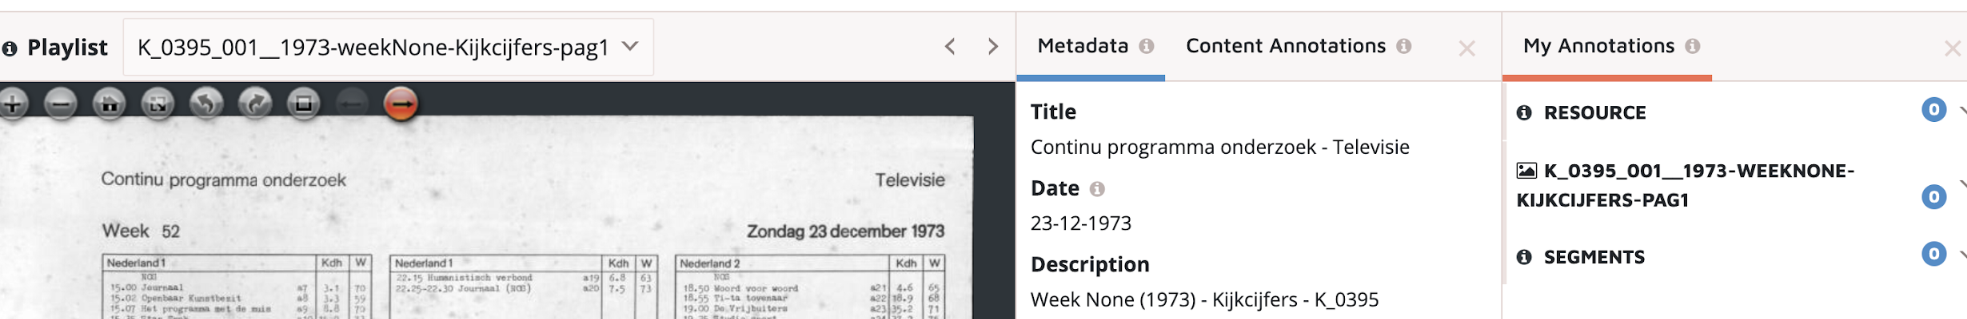
You should now be able to select the correct week report more easily (hint: weekly report 48). Click on it to open the resource viewer.
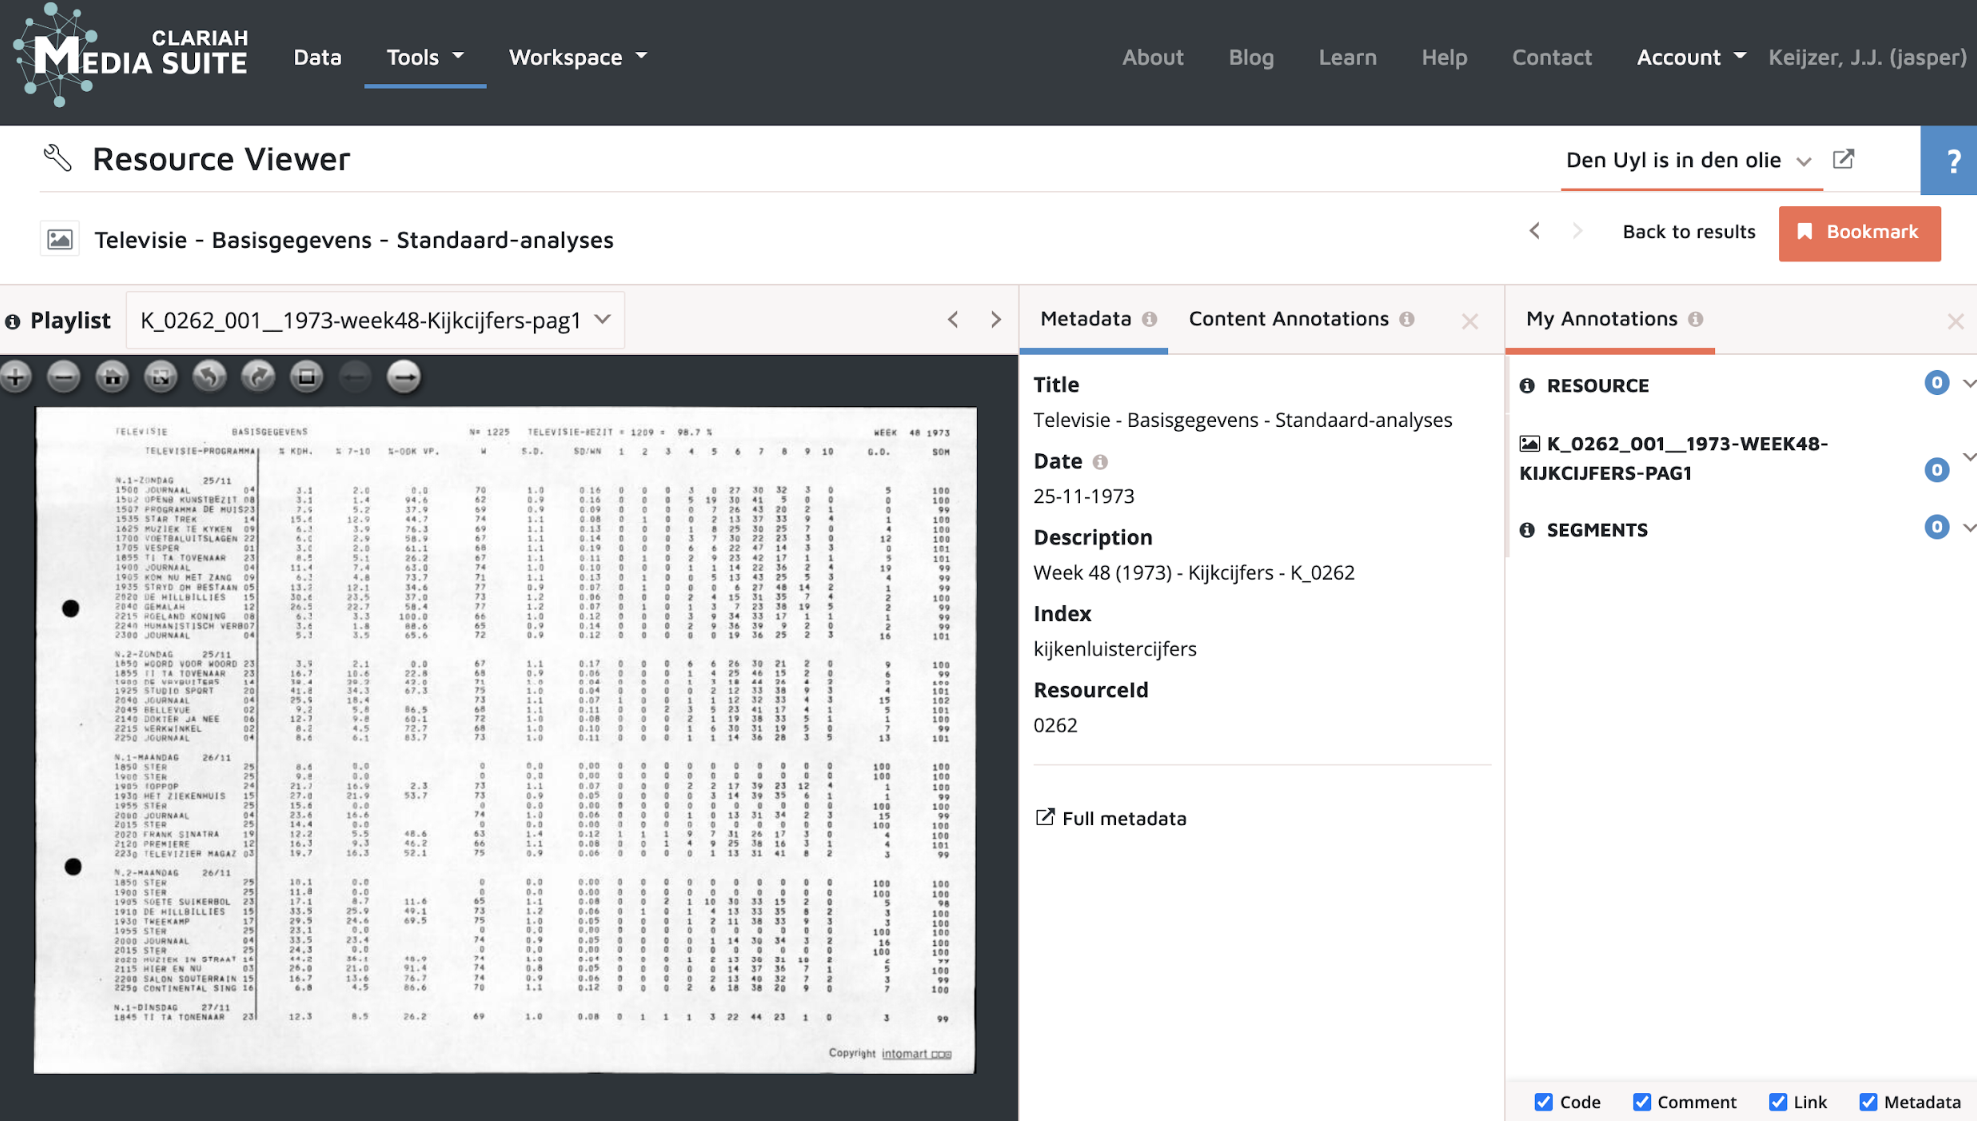
8. Weekly viewing reports
-
Take a moment to inspect the viewing report. The report consists of 16 pages, try navigating through the pages and look for a structuring logic. How are the days structured within the week, how are the different categories structured?
-
Reflect on the connection between structuring logic and value attribution . Which category of viewing figures is displayed the clearest or has the most prominent role ? What does %KDH (kijkdichtheid) refer to? What does that indicate about how the reports are used?
-
Find the page that shows the viewing figures for the evening of 01-12-1973. Can you find the exact moment of the television address? Why not?
-
How big is the gap in the viewing figures at the supposed time of the television address? Consider the normal running time of STER by comparing the previous commercial blocks on the same date. Does the gap in figures correspond to the anticipated length of the speech?
-
Beyond the weekly reports on viewing rates the collection also contains bundled yearly reports. It should be noted that these reports were also produced on a weekly basis. The weekly reports were bundled by the public broadcasters in the archiving process. Perhaps we can cross reference the weekly report data with the bundled year report of 1973. But first, let’s bookmark the item so we can find our way back easily.
-
Click on the orange ‘bookmark’ button in the top right corner. Add a bookmark group named ‘viewing rates’ and click on the blue ‘save’ button.
-
Tip: You can leave the resource viewer open in a different tab, this will make the process of comparing sources much easier.
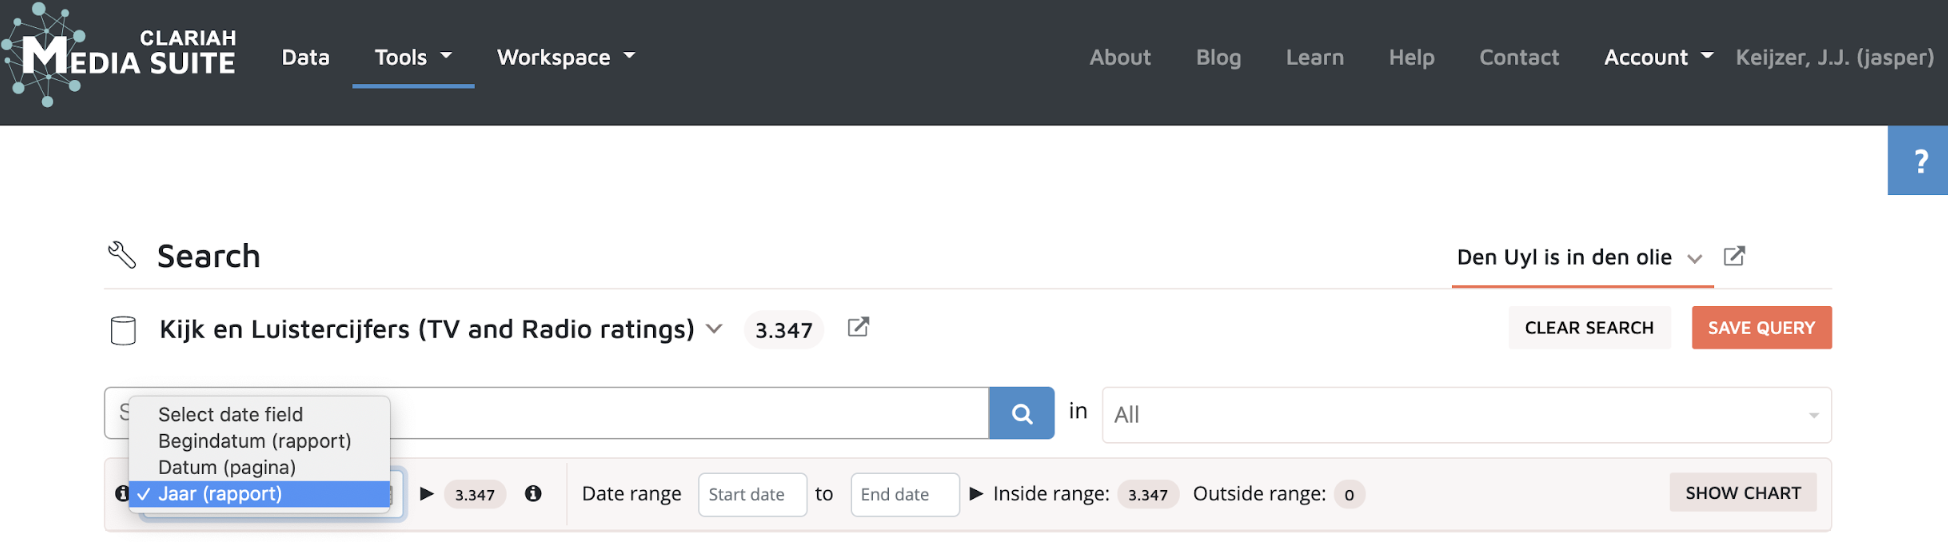
9. Searching for yearly viewing reports
-
When you return to the search tool, always check if you are still searching the correct collection.
-
Click on ‘date field’ and select ‘Jaar (rapport)’ (rapport year).
-
Since we are looking for yearly reports, let’s make the date range a bit bigger this time. Try searching the collection with a date ranging from 01-01-1972 till 01-01-1974.
-
Take a look at the facets, which facets can you already add to lower the amount of results?
-
Consider the usability of each facet. Let’s focus our efforts on ‘report unit’ (rapportage eenheid). We have two options here: W for weekly reports and J for (Jaar) yearly reports. Click the box for yearly reports.
-
Select the item with the yearly report for 1973, the resource viewer will open.
-
Don’t forget to bookmark the item. Try adding the item under the same ‘viewing rates’ bookmark group by selecting the group and clicking ‘save’.
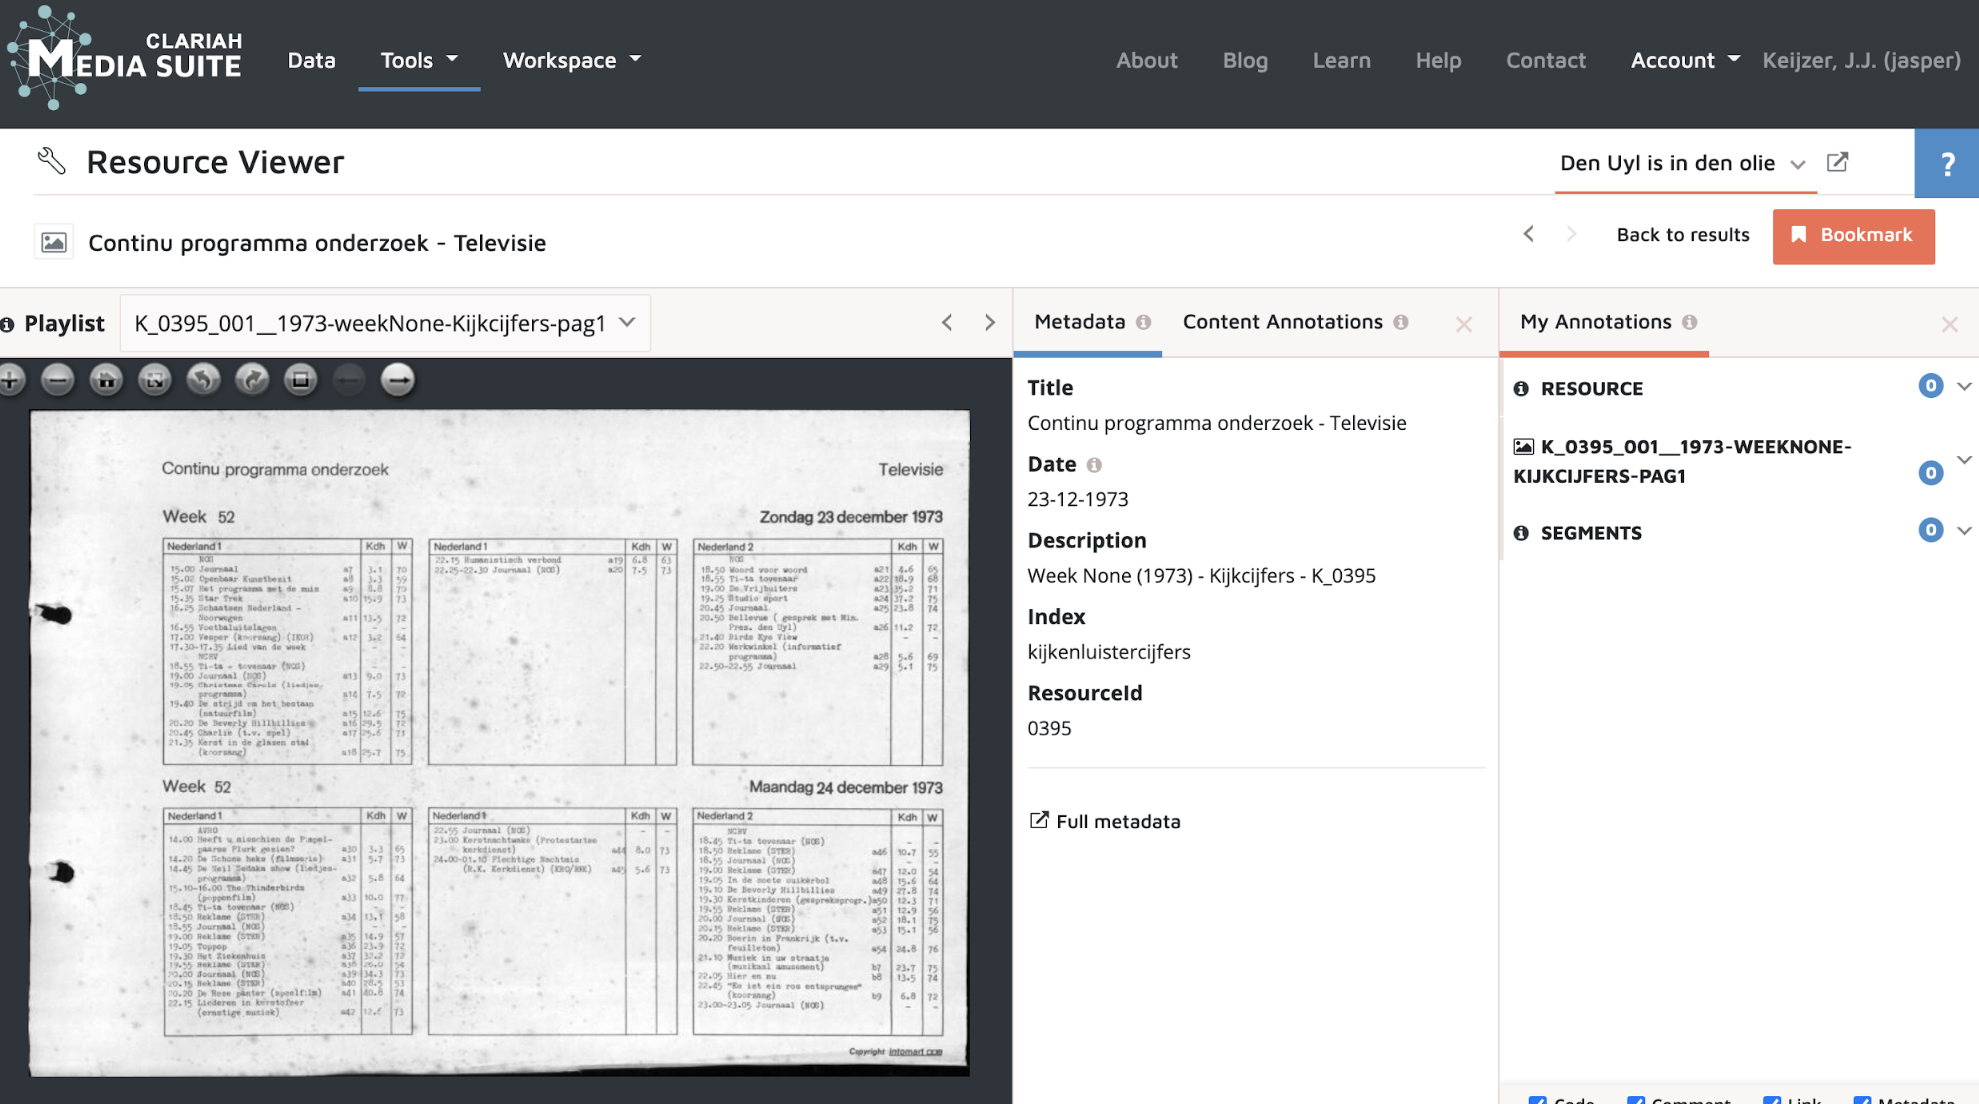
10. Yearly viewing report
-
Again, take a moment to inspect the yearly report. The report for 1973 consists of 252 pages. Navigate through the pages and see if you can find how the days and weeks are structured. Now take a look at the information the report provides, consider the categories, the title names and the time stamps. Does the information correspond with the information in the weekly reports? What is similar, what is different?
-
Find the page that shows the viewing figures of Saturday december 1st. If you have confidence in your ability to “read” the structuring logic, here’s a challenge: try guessing the page number for december 1st.
-
You can also use the arrow buttons in the top left corner of the viewer display to simply turn the pages.
-
Once you have found the right page (hint: page 20) take a look at the evening program schedule. Do you see the program notation of the television speech?
-
We have hit another dead end. Take a moment to reflect on what we found, and what we couldn’t find. Consider the methods of data-collection in relation to the information provided. Why would the program title be blank in the weekly reports, but not in the bundled yearly reports? And why does the viewing figure remain blank in the bundled yearly report?
-
Compare the programming schedule for December 1st channel 1 between the weekly and the bundled yearly report, and pay specific attention to the first few programs of the day. Which correlating factor do you see between the titles that are missing? How would this influence your research when you are using the reports?
-
(Hint: consider the audience measurement methodology of 1973. The programming schedule for a week of broadcasts would arrive 10 days prior, then they had to be manually typed into a computer in order to print the viewing diaries. Any break in the broadcasting schedule would then not be accounted for in the diaries and therefore not be measurable. None of the reports will therefore show the viewing rates of Den Uyl’s television address. The weekly reports contain no information about programs that were not measured. These reports were designed for the advertising interests specifically. The yearly bundled reports contain a complete programming schedule because they were created for public broadcasting.)
11. Patterned response as event ripples
Although the actual viewing rates for Den Uyl’s television address are not researchable, perhaps it is possible to see a patterned response to the speech in the viewing rates around the 1st of december, 1973.
-
Take a moment to reflect on your own viewing behaviour in times of crisis. Which type of programs would you watch more of, what would you watch less?
-
The SKO published a factsheet on viewing behaviour during the first wave of the Corona pandemic in the Netherlands in 2020. Based on a viewing rating comparison before and after the lockdown, SKO argues that there is a 38% increase in the news and current affairs program category.
-
Let us revisit the weekly and yearly reports of 1973. For convenience we have prepared a spreadsheet with the viewing rates data extracted from the Media Suite. Click the link: Viewing rates data for Media Suite tutorial .
-
Take a moment to look through the data and reflect on the comparison as it is set up here. Focus on the news programs (journaal). Is there a fluctuation in the figures for journaal? Can you find a pattern? How do you distinguish between a general fluctuation and a break in pattern?
-
Consider the viewing figures for the seven o’clock news broadcast. How can you explain the increase in KDH%?
-
Congratulations! You have successfully completed the Media Suite Tutorial for using the viewing rate collection for television history!