Media Suite Tutorial: The Viewing Rates of the Fabeltjeskrant
Tutorial for CLARIAH Media Suite V 5.3 Tutorial made by Jasper Keijzer, August 2021
Tutorial Description, Case and Objectives
This tutorial introduces you to using the CLARIAH Media Suite’s search tool and bookmarking functionality for research with the viewing and listening rates collection. The tutorial specifically introduces you to ways of using the Media Suite that support television history teaching and research that aim at critically evaluating processes of viewing rate research and data driven research in television history. Upon completing this tutorial, you will have learned to use the Media Suite for:
-
Searching and building a multimedia corpus consisting of television materials from Netherlands Institute for Sound and Vision’s Television Collection and viewing reports from the digitized collection held by the SKO (Dutch foundation of viewing rate research).
-
Collecting and bookmarking items from different collections into a personal user project.
-
Creating a general research design, by considering practical and methodological implications of using viewing rates for historical television research.
This tutorial centres around the children’s program: De Fabeltjeskrant. With many iterations spanning across 50 years of Dutch television, the program is etched in the minds of several generations of children and adults, making ‘De Fabeltjeskrant’ a unique piece of Dutch television history. In 2005 the television show was chosen as the best children’s program of the twentieth century.
In total, De Fabeltjeskrant had four iterations in Dutch television history. The original series aired from 1968 till 1974, after which the show was cancelled. In 1985 the show returned to public broadcasters until 1989. For its third iteration the television show had a short commercial revival in the early 1990s. Newly established commercial broadcaster RTL aired ‘De Fabeltjeskrant’ between 1990 and 1992. After a feature film of the Fabeltjeskrant was shown in cinemas in 2018, streaming service Netflix secured the rights to the show and added a single season to their digital library.
This tutorial will specifically address the second iteration of the television series, which ran from 1985 to 1989 on public service broadcast stations. The second iteration is particularly relevant in relation to the history of viewing rates research in the Netherlands as it coincides with a reformation of measurement methods in 1987. Before 1987 the main measurement method was through physical log-books or diaries, distributed and collected through the postal service. Each week, the participants would receive a personal diary with the television schedule, indicate which programmes were viewed, and then return the diary. From 1987 onwards, the electronic Peoplemeter was introduced. Many of the changes that resulted from the automation informed the way that audience measurement is conducted until today. This tutorial will discuss the changes that occurred, the consequences of those changes for the validity of audience measurement and therefore the considerations that accompany any research project that utilises historical viewing rates.
Information page viewing rates
If you need information on how to read viewing rate reports, visit the
‘How To’ page here
Prerequisites No previous experience with the Media Suite is required. If you are already familiar with logging in, you can start this tutorial at step 1. If not, you can find a tutorial on logging in and setting up a research project on the Media Suite Learn page. Please note: This is a tutorial for beginners. For a tutorial on the viewing rates at an advanced level, please go to this tutorial on the Oil crisis .
1. Searching and Bookmarking television broadcasts
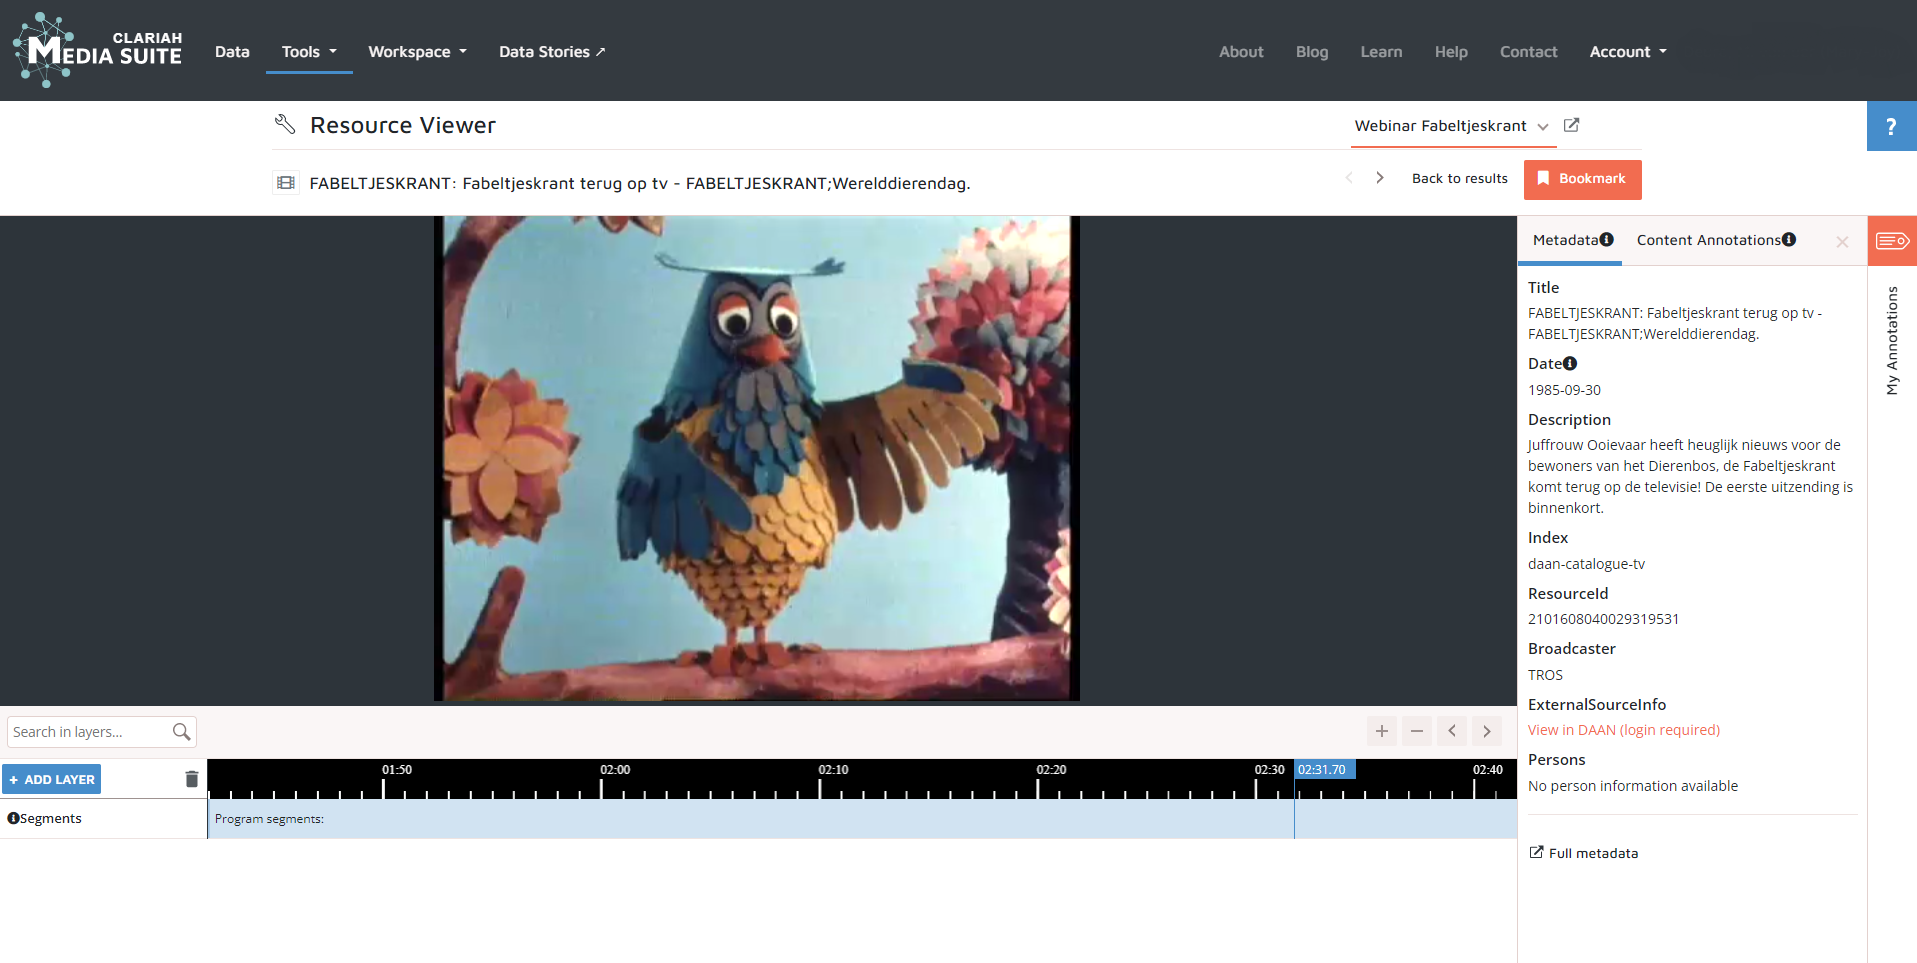
Before diving into the viewing rates, we will first search for the broadcast for which the audience was measured. For the first part of the tutorial we will search for the television broadcast of the first episode of the second iteration of ‘De Fabeltjeskrant’. This aired on september 30th, 1985.
-
Before we start searching, go to the workspace tab and create a user project. I’ve named my project ‘Webinar Fabeltjeskrant’, but feel free to get more creative. The user project will allow us to save items and queries, which is especially useful when you are searching for multiple sources.
-
Once the user project is set up, click the tools tab and select search. You will now enter the search tool. You can check in the top right corner if the correct user project is selected. The name should be displayed above the orange line. If not, click on the drop down icon and select the correct user project.
-
Now it’s time to select the collection. Just above the search bar in the top left corner, you will find a pre-selected archive collection. Click on the drop down menu icon to open the collections menu. Select “Sound and Vision Archive - Television”.
-
For the first search, try using only the search bar. Fill in the word ‘fabeltjeskrant’. How many results are found? (this number is located below the search bar and highlighted in blue). Which different types of results does the search yield?
-
On the right hand side of the primary search bar you can specify in which metadata field you wish to search. If you click on the bar a drop down menu appears. The first option displayed: ‘all metadata fields’ is the default option. Your first search term was therefore cross-referenced with all the metadata fields.
-
Select the metadata field ‘titles’ and add this to your previous query. (leaving the search term ‘fabeltjeskrant’ in the main search bar and not selecting a date field just yet). How does this impact the amount of search results? Review the first five to ten search results without opening the items. Pay special attention to the dates located at the bottom of the result, next to the video icon. Do you notice a large range in dates?
-
Try to specify your search further. Directly below the search bar you can select a date field. Note that there is an abundance of options. Most of these options are very helpful when searching for a known result based on very specific knowledge about that item. Since we only know the broadcast date, it is best for our purpose to select the preferred option: ‘date, sorting (preferred)’. Scroll down and click on it.
-
Once selected you are requested to add a date range. Try searching for a two week window, just to be safe. Fill in 13-09-1985 - 05-10-1985. How does this affect the amount of search results? As you can see, not all search results are relevant. Can you find the one that is?
-
Once you have found the correct broadcast make sure you bookmark the item so you can revisit it from the workspace. Press the orange bookmark button in the top right corner and create a bookmark group.
2. Searching and Bookmarking viewing rates
Now we have confirmed that the Fabeltjeskrant broadcast was aired on 30-09-1985, we will search for the corresponding viewing rates.
-
Go back to the search tool by clicking on tools → search and change the collection to: “Kijk en luistercijfers (TV and Radio ratings)” collection.
For your first search, try using the same keyword searches as in the other collection by adding the keyword ‘Fabeltjeskrant’ in the search bar. Review a couple of the results given. Take a moment to reflect on the relation between search terms and search results. How does the algorithm connect the two generally? How will the desired results influence your searching strategy? -
The TV and Radio ratings collection requires a different approach to searching. Because of the manually typed in program titles, oftentimes abbreviated in different ways, the viewing reports require a different search criteria. We know the broadcast date, so let’s focus on that.
-
Since we are looking for weekly viewing rate reports, let’s start by selecting a similar date field as in our last search (13-09-1985 - 05-10-1985). Click on the ‘select date field’ tab and select “begindatum” the starting date of the report.
-
Before you click search, remove the title ‘Fabeltjeskrant’ from the search bar. When the search bar is empty, press enter or click search.
-
You will now have a number of search results. Some of them are desirable and some are not. Let’s take a look at the facets on the left hand side of the interface. Facets allow you to filter the results.
-
The first facet generally gives three options, K, L and R. Respectively these are Kijkcijfers (viewing rates), Luistercijfers (listening rates) and Reclamecijfers (commercial rates). Select facet K and revisit the search results.
-
You should now be left with a small amount of results. If you check the dates you will find that there are two reports. Open both and see how they differ. (hint: it is mentioned on the first page. One report is for ages 3-11, the other is for ages 12 and up. Select the report for ages 12 and up, you will see why in a couple of steps. Once the report has opened, quickly bookmark the item so you can return to it more easily.

3. Reading viewing reports
If this is your first encounter with a viewing report, it can be a daunting experience. This step will guide you in understanding how to read a viewing report.

-
Take a moment to inspect the viewing report. The report consists of 62 pages, try navigating through the pages and look for a structuring logic. How are the days structured within the week, how are the different categories structured? Can you make sense of the abbreviations of the categories? If not, keep turning the pages. Abbreviations are explained from page 16 onward.
-
Find the page that shows the viewing figures for the evening of 30-09. The Fabeltjeskrant was broadcast just before 19:00 on the first channel ‘Nederland 1.’
-
The main unit of viewing rates is viewer density, or ‘Kijkdichtheid’ in Dutch, which is abbreviated as: %KDH. What number is indicated as the %KDH? Can you guess what the number actually indicates?
-
Just in case the previous steps were confusing, we are on page 3 of the report and the Fabeltjeskrant is placed halfway through the first column on the left. Also, viewer density refers to the amount of people tuning in in relation to the total number of people in the Dutch population. 21% KDH therefore indicates that out of the total number of Dutch citizens aged 12 and up, roughly one in five have viewed the ‘Fabeltjeskrant’ that evening. You have found the first result of the comparison, well done!
4. Searching for viewing rates
Let’s search for the viewing rates of the last episode of the second iteration. I would normally advise to check if the broadcast was actually aired, but for the sake of the tutorial I have checked this beforehand. The final episode of the ‘Fabeltjeskrant’ aired on March 31, 1989, at 18:54 pm.
-
Adjust the date field accordingly. In our last search the starting date of the report was the date of the broadcast. This time, these two dates are different. Consider applying a two or three week window to the date field to make sure your search criteria are not too narrow. If needed, filter your search results with the facets.
-
Once you have found the correct report, open it. (hint: the starting date of the report is 27-03-1989)
-
Flip and skip through the pages and try to find the structuring logic. Are the reports still structured the same?
-
If you click on the dropdown menu to reveal the page range, you will find that the number of pages in the viewing reports have increased considerably since 1985. Can you find a (quite practical) reason for that increase? (The public broadcasters added a third channel, Nederland 3, in April of 1988)
-
Try to find the ‘Fabeltjeskrant’ episode on Friday, March 31st.
Having trouble locating the television show? Is it not where you first expected? You know it should be here, you (I) have checked that the episode was aired on this date. Try and look a little further. -
The viewing rates for the ‘Fabeltjeskrant’ can be found on page 101. It was aired on the second channel, Nederland 2.
-
On which category of viewing rates should our comparison be based? In 1985 the categories based on age were divided into 3-11 and 12+. In this report from 1989 you will see that there are no measurements of children under the age of 6 (to this day, this is still the case). Luckily for us, we focussed on the 12+ category instead of the 3-11 before.
-
The category tot (total) 13+ has the least deviation from our previous selection. What is the %KDH value for the final episode of the ‘Fabeltjeskrant’? It seems that the viewing rates for the second iteration of the ‘Fabeltjeskrant’ have declined in four years, from 21%KDH to 4%KDH. In the next step, we will consider what this means.
5. Determining the accuracy of the viewing rates
Section 5 is recommended for a supervised session.
-
You have found two reports that contain viewing rates for television broadcasts of ‘De Fabeltjeskrant’. In this step we will compare the validity of these figures based on the methods used to gather them. Consult the “How To” page about viewing rates methods and reflect on the following questions:
-
With which method were the values in the viewing report of 1985 measured and calculated? What can be said about the margin of error? Which kind of errors would likely occur with this method?
-
With which method were the values in the viewing report of 1989 measured and calculated? What can be said about the margin of error with this method? Which kind of errors would likely occur?
-
Which of the two reports can be argued to be more reliable. What does that say about the reports usability for television historical research?
Congratulations on successfully completing this tutorial! On a final note, I would like to leave you with a more philosophical query. Try and contemplate how audience measurement methods conceptualise what television viewing is. Do you agree with this conceptualisation? Can you think of viewing experiences that would fall outside of this measurement, but would be valuable to record?