Compare queries
The compare tool facilitates comparative (re)search based on multiple queries in the same or different collections. This tool uses all the data and enrichments available via the Media Suite for comparison of the results.
How to use
To go to the Compare tool, navigate to ‘Tools’ in the drop-down menu at the top of the page, and select ‘Compare’. Hereafter, there are two possible cases.
1. If you have previously saved queries in a user project:
-
Go to “Set project.” Here you can select the correct user project
-
You will see a list of your “saved queries” with their name and some details
-
Tick the boxes next to the queries and click on ‘Compare’ at the bottom of the page.
-
Per query, a box will appear, summarising the query
-
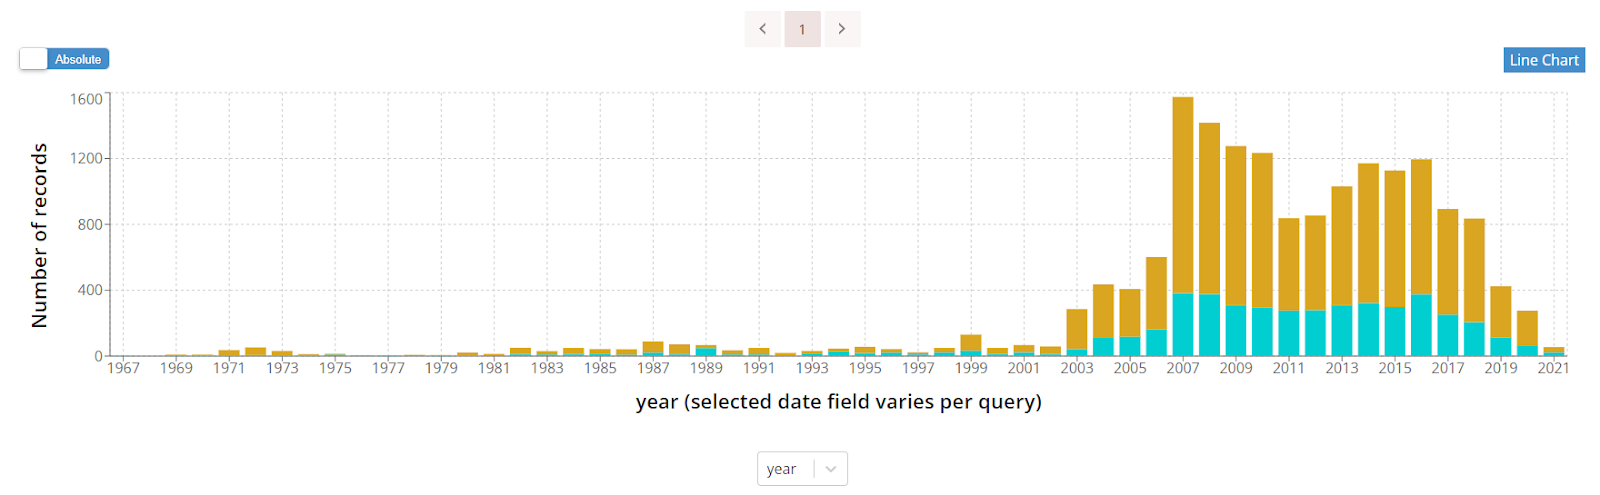
If a date field was selected in the query, then the chart visualisation will show the aggregated results per query over time
-
It is also possible to directly compare the queries in the Workspace environment by following the same steps.
2. If you do not have any saved queries:
-
Click on “Add query” in the Compare tool
-
You will be prompted to the Search tool
-
There you can save a query in a user project
-
You are now ready to use the Compare tool
Chart options
Absolute/relative
By default, the chart is plotted with the numbers of results found per date interval. Sometimes you may prefer to see the relative frequencies of the results. You can do this by clicking on the slider that says ‘Absolute’.
The slider will then change to read ‘Relative’.
By default, the relative frequencies (percentages) shown in the graph are calculated by dividing the number of items with hits by the total number of items in the collection within that year (or week, day, depending on the ‘date unit’). For example, if the value for 2018 is 5%, then this means that 5% of the items in the collection with the date 2018 matched the query.
It is also possible to use the facets in the query as a reference. For example, you could have a query for the search term ‘politics’ with facets for mediaType ‘video’ and broadcaster ‘NOS’. Using the facets as a reference would show, per date interval, the percentage of videos from the NOS containing the term ‘politics’. To change the reference, click on the slider that says ‘to the collection’. This will change to read ‘to the query facets’. The chart is then displayed relative to the facets.
Date options
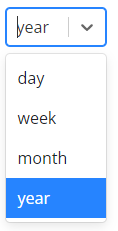
By default, the chart is displayed with values per year. Using the dropdown menu underneath the chart, you can change this to months, weeks or days.
Tip : When using the option ‘day’, make sure you have set the date ranges for your queries to be as specific as possible. This makes the chart quicker to load and easier to read.
Tip : When using the option ‘week’, be aware that the first few days of January often fall under the last week of the previous year. E.g. 1st January 2021 is in week 53 of 2020.
Viewing search results
To view the results for a query for a given date interval, click on the bar/dot for that query in that date interval. The Search page will open with the query loaded, and the date range corresponding to the date interval selected. When you are finished looking at results, you can use the back button of your browser to return to the Compare tool, or select the Compare tool again from the menu.
Tip : If there are many dates on the graph, then it can be hard to click on the right bar/dot. Limit the date range of your query to make it easier to click on the right bar/dot.
Tip : Sometimes an item has more than one date value. You may then see results on the graph that fall outside your selected date range. For example, if you have searched for the date range 1913-1915, and an item has the dates 1913 and 1924, then you will also see results for 1924 on the graph. If you click on the point for 1924, then all results in 1924 matching your query will be shown, not only those that also have a date in the range 1913-1915. In such cases the number of results shown on the Search page may be larger than the number shown on the graph.
For examples of how the Compare tool is applied in research, please see the following pages in the ‘Learn’ environment: